80+
Healthcare brands served
2,000+
Locations under management
600+
Data integrations & connectors
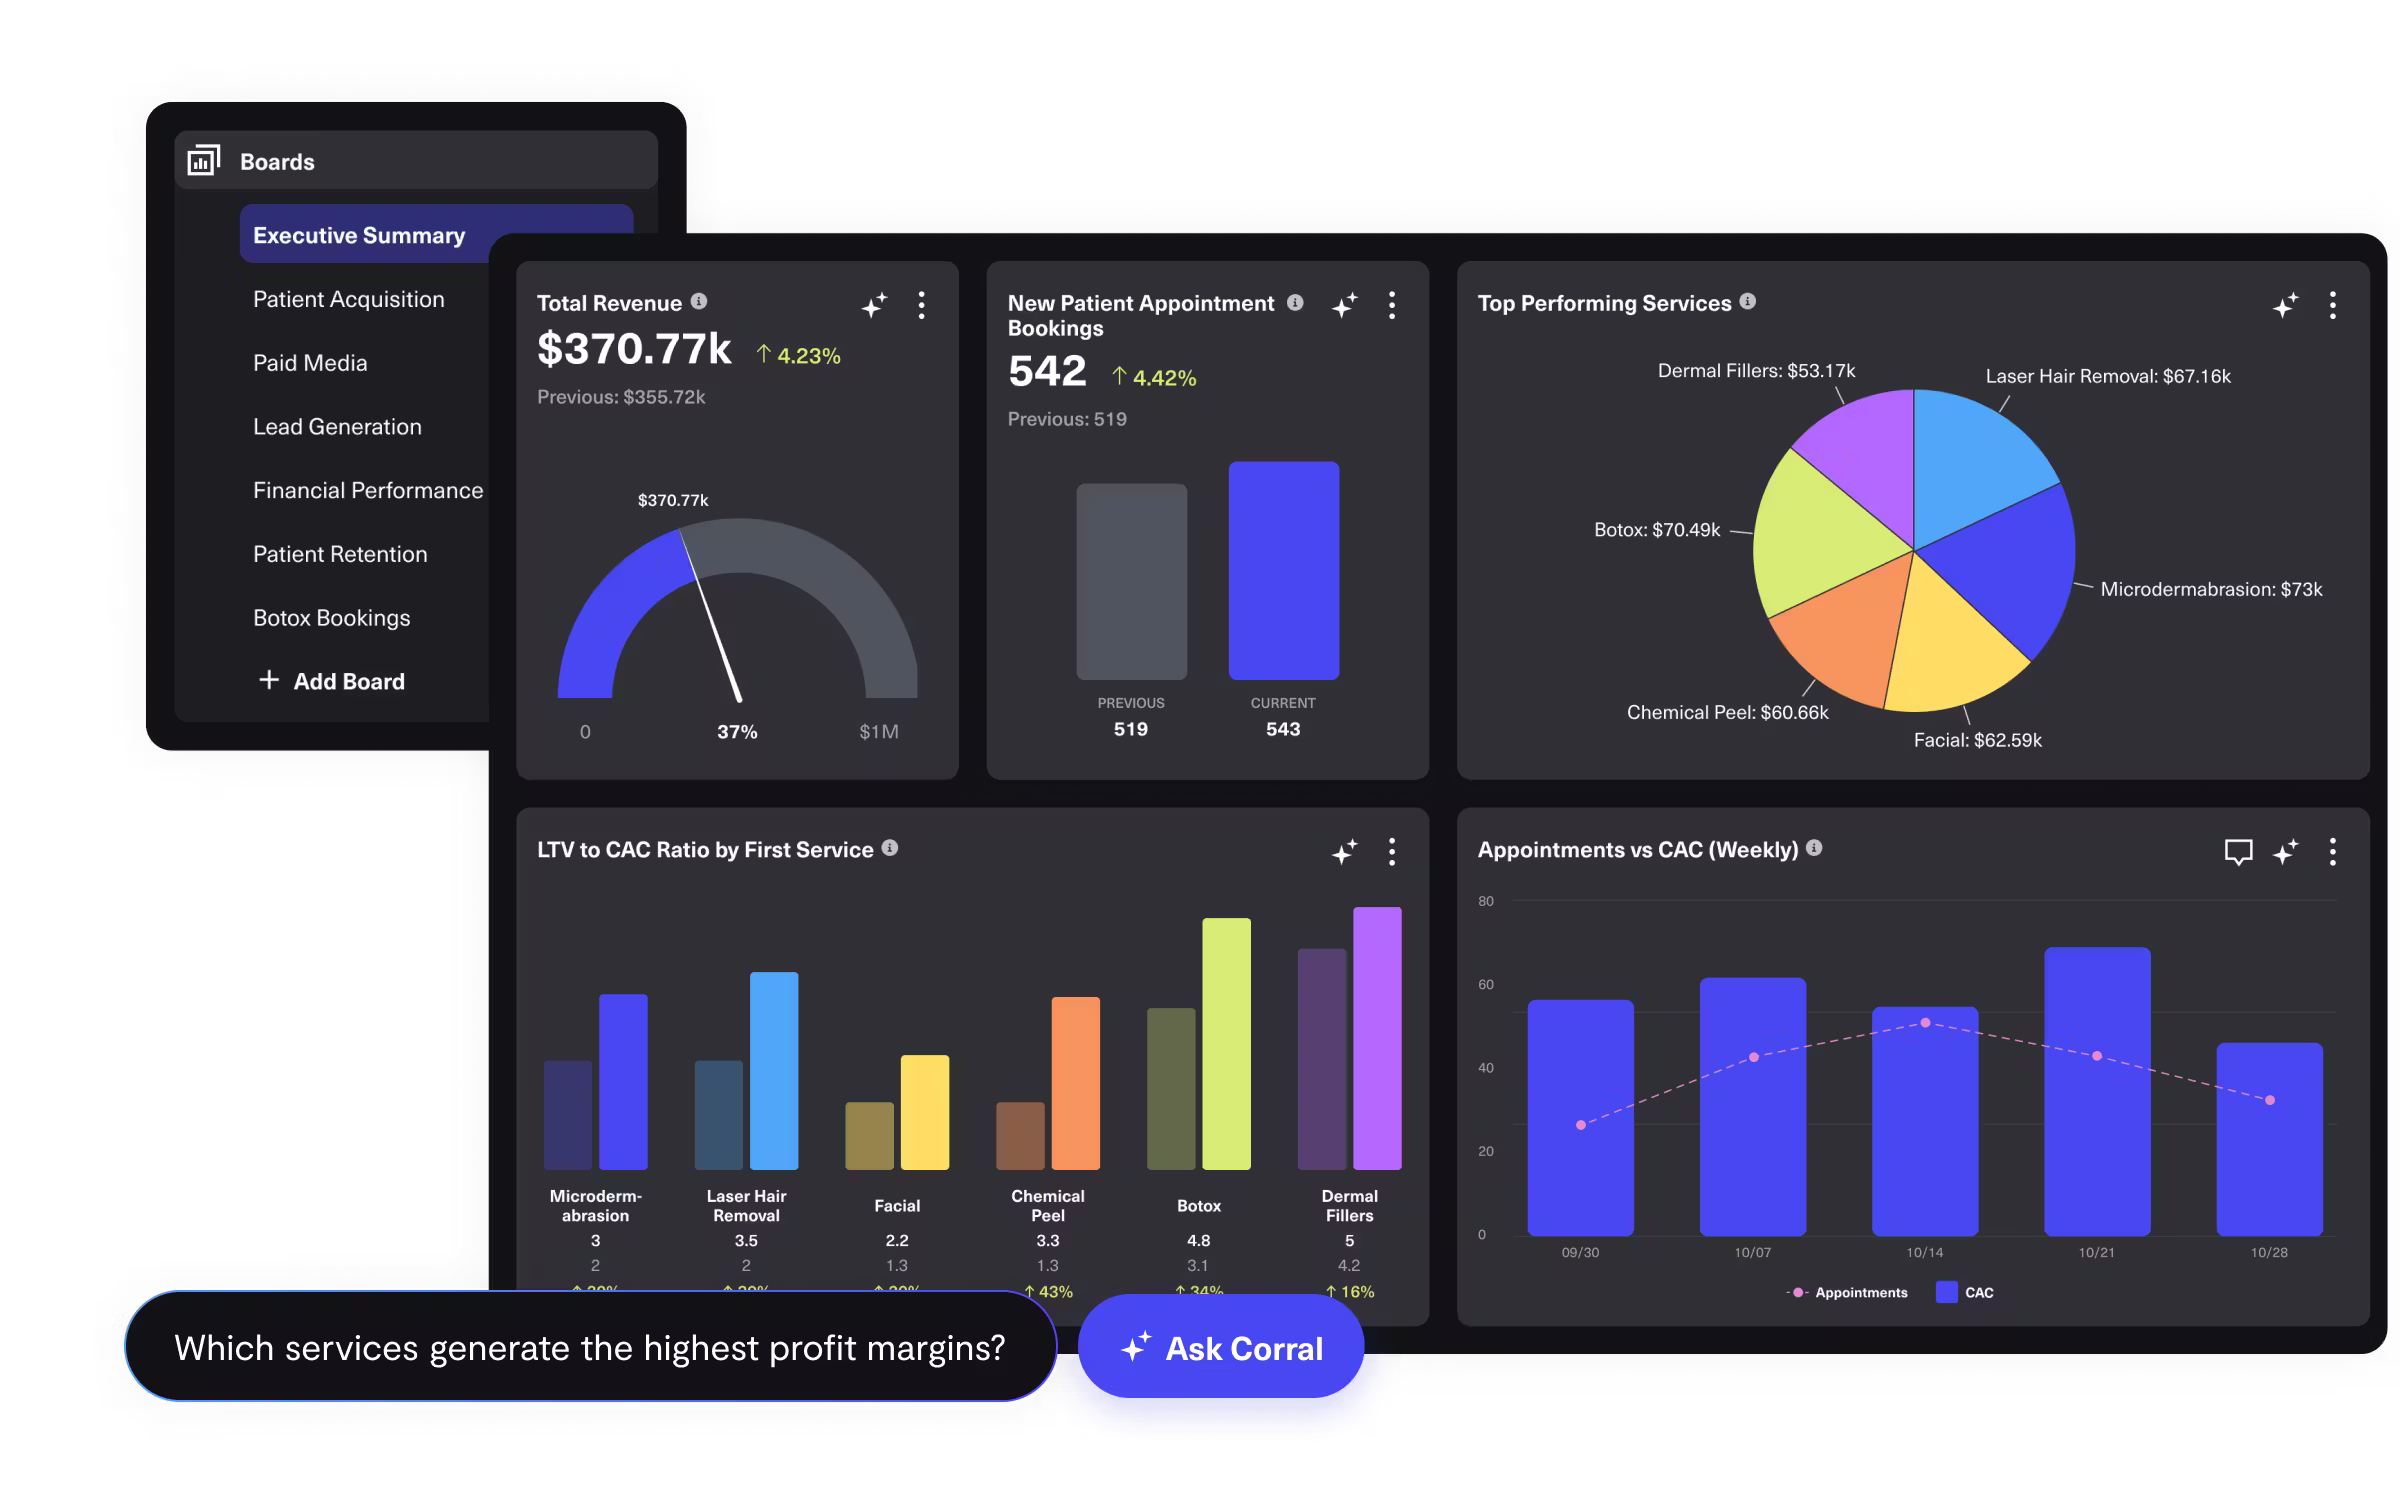
AskCorral Agent
Ask anything. Build anything. Act on what you find.
AskCorral Agent is your AI data team. Ask it any question about your organization, have it build dashboards on demand, and let it act on the opportunities it uncovers — no technical skills required.
Which marketing channels are driving our highest-LTV patients this quarter?
What's our patient LTV by location?
Which providers have the highest 90-day retention?
Where are we losing revenue to no-shows?
What's our ROAS across all paid channels?
Which locations are below their revenue targets?
What's our schedule utilization by day of week?
Which service lines have the highest margin?
How does patient acquisition cost vary by channel?
Which patients are most likely to churn?
What's our rebooking rate by provider?
Where are we leaving money on the table?
See it in action by team
Marketing
Stop spending on channels that don't convert patients.
See exactly which marketing channels and campaigns drive your highest-LTV patients — by location, by service line, by acquisition source. Stop guessing and start optimizing with full-funnel attribution.
Metrics you can answer instantly
ROAS by Channel
LTV:CAC Ratio
Cost Per Patient Acquisition
Lead-to-Booking Conversion
New Patient Attribution
Campaign ROI by Location
Which marketing channels are driving our highest-LTV patients this quarter?
Paid social is delivering 4.2x ROAS on new patient acquisition vs. 2.8x for paid search. However, patients acquired through Google Ads have 34% higher 90-day retention — making them more valuable long-term. Your top 3 campaigns by LTV are all running on Instagram, specifically the before/after content format.
Recommendation: Reallocate 20% of paid search budget to Instagram and launch a Google retargeting campaign targeting your highest-retention lookalike audience. Estimated impact: 15% improvement in blended LTV:CAC within 60 days.
AskCorral Agent acted: Highest-LTV patient profiles synced to Meta and Google Ads as lookalike audiences.
Operations
Know exactly which providers retain patients — and why.
Track provider performance, schedule utilization, no-show rates, and room turnover across every location. Identify what your top performers are doing right and replicate it across the organization.
Metrics you can answer instantly
Provider Utilization Rate
No-Show Rate by Location
Schedule Fill Rate
Room Turnover Time
Rebooking Rate
Staff Productivity Index
Which providers have the highest patient retention, and what are they doing differently?
Provider A has a 91-day retention rate of 78% vs. the team average of 61%. Patients returning to Provider A spend 2.4x more on add-on services at follow-up visits and carry a 3.1x higher LTV.
Recommendation: Audit Provider A's intake protocol and post-visit follow-up cadence. We've flagged 3 providers with retention below 45% — a targeted coaching intervention could recover an estimated $22K/month in revenue.
AskCorral Agent built: Provider retention comparison dashboard created and added to your Operations board — broken down by provider, location, and service line.
Finance
Know which service lines are driving margin — and which are quietly draining it.
Track revenue, margin, and visit economics by location, provider, and service line. Get a clear picture of where growth is happening, where underperformance is hiding, and what to do about it.
Metrics you can answer instantly
Revenue by Service Line
Margin per Visit
Average Visit Value
Revenue per Provider
Cancellation Cost
MoM Revenue Trend
Which service lines have the highest margin this quarter, and where are we leaving revenue on the table?
Aesthetic services carry your highest margin at 61%, but are only filling 58% of available capacity. Wellness visits run at lower margin (34%) but drive 2.8x higher rebooking rates — making them your most reliable revenue floor. Two locations are underperforming on average visit value by 20%+, driven by high single-visit rates.
Recommendation: Target single-visit patients at those two locations with a structured follow-up sequence. We estimate a 90-day reactivation program could recover $18K/month in recoverable revenue across your group.
AskCorral Agent built: Revenue and margin breakdown dashboard created by service line, location, and provider — with MoM trend view.
Instant Insights
Every dashboard,
instantly explained.
Hit the wand button and CorralData's AI delivers an immediate summary highlighting what's working, what's broken, and where to focus next.
📅
Scheduling Utilization
Tuesday afternoon slots are running at 54% utilization — 22 points below your weekly average. This gap is costing an estimated $18K/month in recoverable revenue across locations.
→ Tuesday underperformance is driven by same-day no-shows, not low demand — your waitlist has patients requesting that exact slot. An automated SMS outreach to that group could fill 70%+ of the gap before slots go to waste.
Provider Performance
Provider A has a 91-day retention rate of 78% vs. the team average of 61%. Patients returning to Provider A spend 2.4x more on add-on services at follow-up visits.
→ Provider A's retention edge correlates with a structured 3-touch follow-up in the first 30 days post-visit — a behavior that's measurable and replicable. Adapting it for your 3 lowest-retention providers could recover an estimated $22K/month.
🚀
Activation
Patients who book multi-service appointments have a 3.1x higher LTV than single-service patients. This segment has grown 28% in Q1 but isn't being targeted in your paid campaigns.
→ This high-LTV segment is growing but invisible to your paid campaigns. Running your next campaign against a lookalike of these patients — shifting just 10% of budget — could drive 15-20% lower CAC while targeting your most profitable profile.
What we track
The metrics that matter most for healthcare practice performance.
💰
Executive
Revenue
Revenue per Location
Patient LTV
Profit Margin
Retention Rate
📣
Marketing
ROAS by Channel
LTV:CAC Ratio
Customer Acquisition Cost
Lead-to-Booking Conversion
New Patient Attribution
💬
Patient Experience
Net Promoter Score
Avg. Wait Time
Rebooking Rate
Review Ratings
No-Show Rate
⚙️
Operations
Schedule Fill Rate
Provider Utilization
Room Turnover
Staff Productivity
Cancellation Rate
Your Dedicated Data Team
White-glove support from day one.
Our team of engineers, data scientists, and analysts becomes your dedicated data partner — from onboarding to ongoing optimization.
🚀
Seamless Onboarding
We connect your systems, model your data, and configure your KPIs. You're live in days, not months.
💻
On-Demand Data Experts
Need a custom report or a new dashboard? Our US-based team of data engineers and analysts builds it for you.
📈
Ongoing Optimization
We don't disappear after go-live. Regular check-ins, proactive recommendations, and continuous improvements.
Integrations
600+ connectors. One unified view.
Zenoti
athenahealth
Meevo
QuickBooks
Salesforce
Google Ads
Meta Ads
HubSpot
Sage Intacct
Workday
Klaviyo
Nextech
ModMed
PatientNow
PatientNow
Zenoti
athenahealth
Meevo
QuickBooks
Salesforce
Google Ads
Meta Ads
HubSpot
Sage Intacct
Workday
Klaviyo
Nextech
ModMed
PatientNow
PatientNow
Google Analytics
CallRail
Intercom
Adobe Analytics
SurveyMonkey
Liine
Aircall
Freshdesk
Microsoft Dynamics
JustCall
PostgreSQL
Mixpanel
LinkedIn Ads
Delighted
AdRoll
Google Analytics
CallRail
Intercom
Adobe Analytics
SurveyMonkey
Liine
Aircall
Freshdesk
Microsoft Dynamics
JustCall
PostgreSQL
Mixpanel
LinkedIn Ads
Delighted
AdRoll
.svg)
CorralData has been an essential partner in hyperscaling our PortCos. The platform gives us consolidated, real-time reporting that allows us to effortlessly track, analyze, and improve outcomes.
— Kieren Dwyer, Managing Director, Leon Capital Group
Case Studies
See how healthcare organizations are growing with CorralData.

Behavioral Health · Multi-Location
See how Geode Health matched paid media bookings to actual patient outcomes across 36+ locations while keeping all PHI HIPAA compliant.
Read case study →

Aesthetics · PE-Backed Rollup
See how Advanced Medaesthetic Partners scaled profitability and enhanced patient care across their portfolio with consolidated reporting.
Read case study →

Weight Loss · Multi-Location
See how Options Medical Weight Loss maximized their LTV:CAC with full-funnel attribution and HIPAA-compliant data unification across locations.
Read case study →
Trusted by leading healthcare & aesthetics brands


and many more
Frequently Asked Questions
Common questions about CorralData for healthcare.
What EMR and practice management systems does CorralData integrate with?
+
CorralData connects to over 600 data sources including Zenoti, athenahealth, Meevo, PatientNow, Nextech, ModMed, Cerbo, and many more. Beyond EMR and PMS systems, CorralData also integrates with marketing platforms like Google Ads and Meta Ads, CRMs like Salesforce and HubSpot, and financial systems like QuickBooks and Sage Intacct.
Is CorralData HIPAA compliant for healthcare organizations?
+
Yes. CorralData is fully HIPAA compliant with enterprise-grade security, end-to-end encryption, role-based access controls, and a signed BAA available for every customer.
How long does it take to set up CorralData for a healthcare organization?
+
Most healthcare organizations are live in days, not months. CorralData's team handles all data connection, business logic mapping, and KPI configuration — built around how your business actually operates.
What healthcare KPIs does CorralData track?
+
CorralData tracks patient retention rate, revenue per location, patient LTV, provider utilization, LTV:CAC ratio, no-show rate, marketing ROAS by channel, schedule fill rate, rebooking rate, and any other metric that exists in your connected data sources.
Does CorralData work for PE-backed healthcare rollups with multiple brands?
+
Yes. CorralData specializes in multi-location and multi-brand healthcare organizations, including PE-backed rollups. The platform consolidates data across locations, brands, and systems into a single unified real-time view.