Use AI to effortlessly answer any business questions from all your data.
CorralData MCP brings your business data and intelligence directly into Claude and other AI assistants
Build and share custom data applications powered by your connected data.
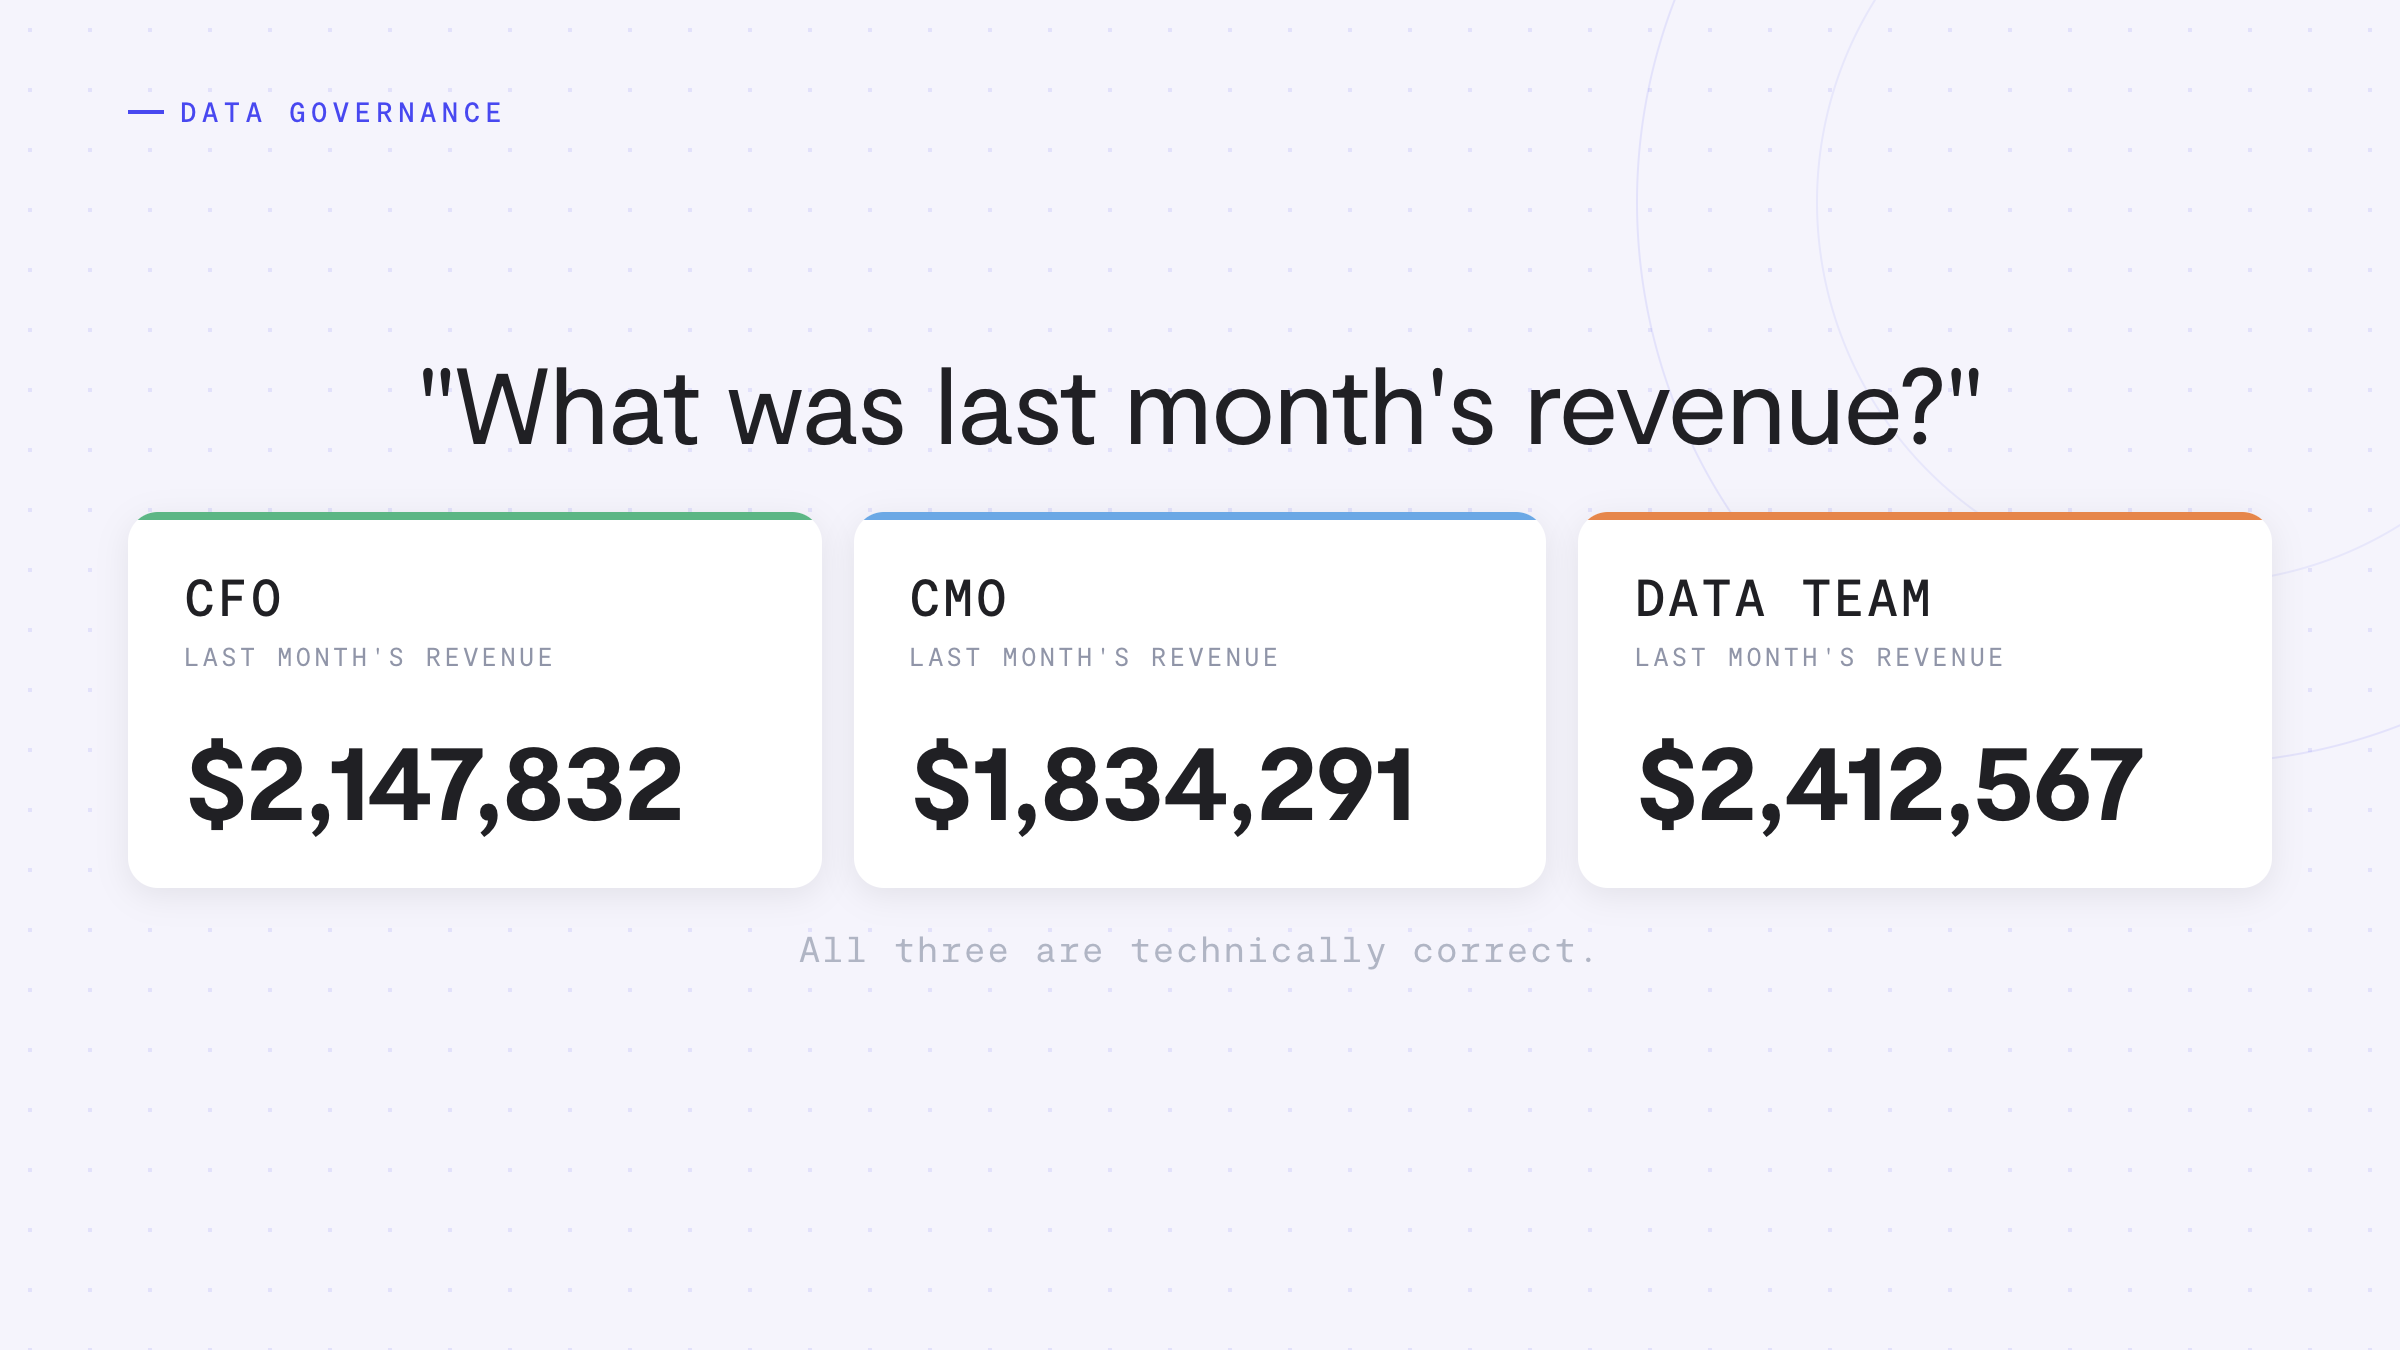
See where accuracy is won or lost across your data stack, and how a governed foundation changes the outcome.
Harness the power of AI without compromising on security.
A dedicated Technical Account Manager guides your team through it
Turn any dashboard into a clear, actionable summary in just one click
AI agents detect opportunities in your data and sync them across your platforms with our fully-managed Reverse ETL.
Sync data from 600+ sources, align KPIs, and see portfolio-wide results instantly.
Give every role the same board, filtered to exactly what they're allowed to see.
Help your clients become data driven faster through seamless reporting and collaboration tools.
Grow your census and strengthen your bottom line with HIPAA-compliant analytics.
AI-powered analytics for dental practices and DSOs. Track production, case acceptance, patient recare, and marketing ROI.
Turn data into success with complete visibility of every consumer interaction.
Make data-driven decisions that enhance patient care and your bottom line.
HIPAA-compliant AI agents that optimize operations, marketing, and patient care across every med spa location.
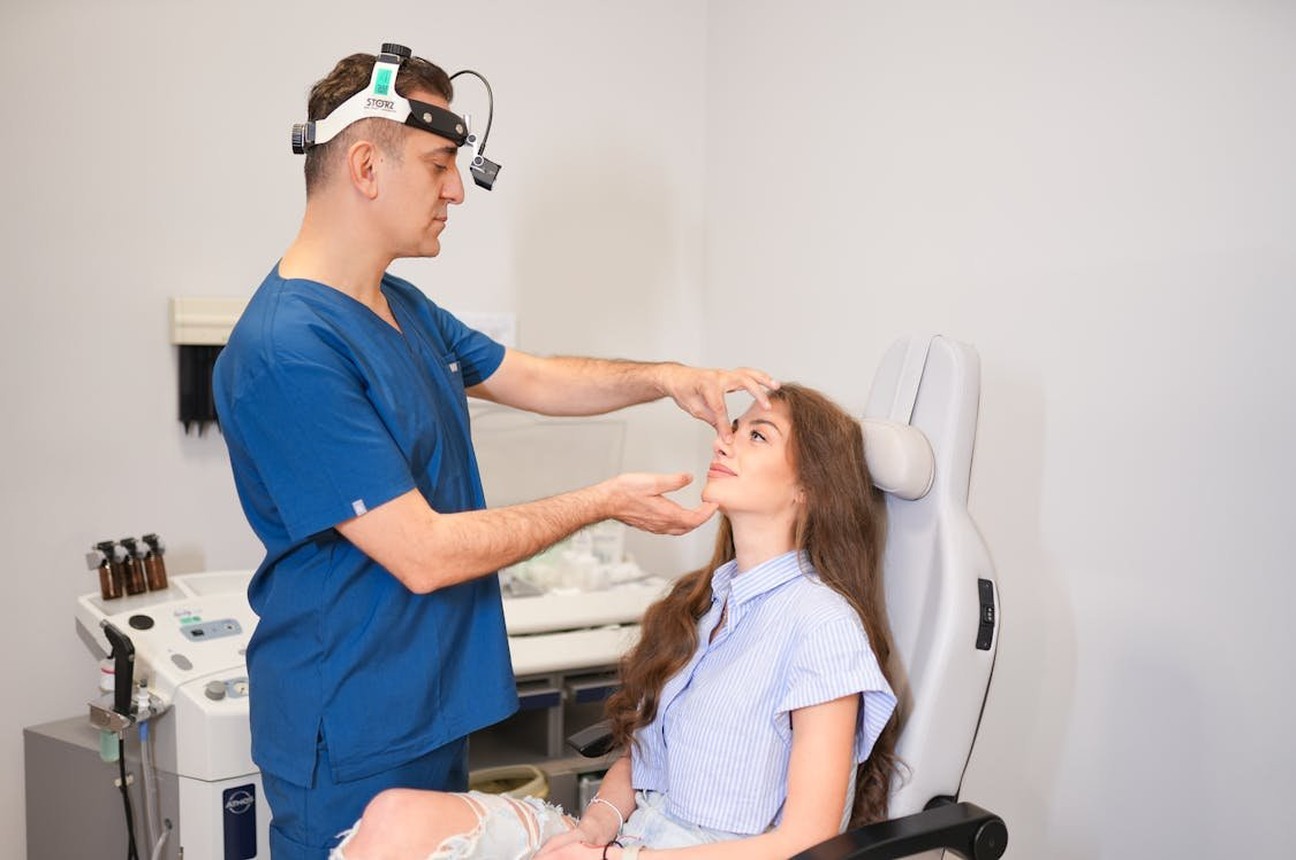
AI-powered analytics for plastic surgery practices. Track consult conversion, surgeon performance, and marketing ROI.
AI agents that monitor, analyze, and optimize performance across every portfolio company.
Easily surface the data you need to increase sales and drive revenue.
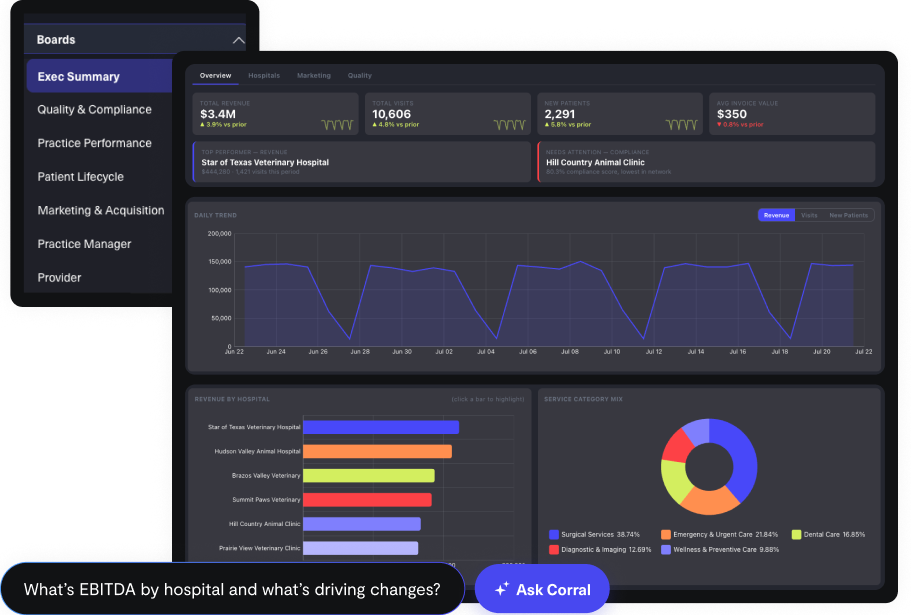
Measure every hospital the same way and track compliance across your whole group.
See how AMP scaled profitability and enhanced patient care
See how CorralData & Evolve Results built ADVENT a true ROI engine
See how AMNH gained a better understanding of the ‘why’ behind their data
See how BodyLase unlocked full data visibility, enabling smarter marketing and stronger results
See how evolvetogether used AI-powered insights to shape a unified growth strategy
See how Geode Health unlocked the value of their data while protecting patient privacy
See how Engine identified and converted more high-value customers
See how AI and unified data drove revenue growth at Inspire Aesthetics
See how Lacoste boosted their e-commerce performance with AI-driven insights
See how Moon Juice used live insights to find, reach, and convert their best customers
See how Olympus uses data and AI to fuel growth
See how Options Medical Weight Loss maximized their LTV:CAC
See how Pfizer turned complex data into actionable marketing intelligence
See how Ready Set Rocket streamlined client reporting and unlocked actionable insights
See how Solo Stove measures true channel ROAS with a marketing mix model in CorralData
See how St. John Knits increased marketing efficiency by 50%
See how sweetgreen acquired new customers and built stronger relationships with their most loyal patrons
Featured case study
Advanced MedAesthetic Partners (AMP) invests in medical aesthetic practices and operates as an aligned business partner to their founders. The platform spans 20+ med spa, cosmetic surgery and dermatology brands across 21 states, each with its own Zenoti setup and its own way of counting. Kieren Dwyer, AMP's Chief Growth Officer, and the corporate team came to CorralData with a practical question: How do you measure dozens of practices against the same core metrics, show whether paid media turns into patients and revenue, and give every practice manager a view of their own location without a corporate analyst in the middle?
LiineKey metrics
Challenge
AMP grows by partnership. Every new practice arrives with a Zenoti instance configured in its own way, along with its own mix of ad accounts, lead tools and call tracking. Each also has a leadership team accustomed to reading the business through its own reports. As Kieren pointed out on one call, even two practices on the same Zenoti instance can calculate the same metric differently. Corporate could not reliably compare practices, and practice managers could not see how they measured up against the broader platform.
The original problem was marketing. AMP relied on digital advertising to fill the books, and it needed to know whether paid media spend turned into first appointments and revenue rather than booked slots that never showed. Answering that question meant matching ad platform and lead data to Zenoti guests and invoices while remaining HIPAA compliant.
As the platform grew, the question widened to operations: provider utilization, wages against sales, retail attach rate, collections against target, and whether a de novo location was ramping on plan. Nobody at a practice had time to pull that together by hand, and it was not realistic to expect practice managers and patient care coordinators to assemble it themselves.
What AMP needed from a solution:
Solution
CorralData connected each AMP practice's Zenoti account through its standard integration, then built an organization-level warehouse that unifies every brand and maps each center to its practice and pod. Google Ads, Meta Ads, Google Analytics 4, Google Search Console, Liine, CallRail and HubSpot cover the front of the funnel. Rippling supplies Human Resources Information System (HRIS) and payroll data for labor reporting, Sage Intacct supplies the general ledger, and Google Sheets carry the monthly revenue goals and mappings the corporate team maintains. Zenoti sales history in the warehouse runs from December 2021 to the current day.
Each practice keeps a CorralData account of its own for brand-level reporting. On top, the organization account holds corporate boards such as the AMP Management Executive Summary, operational dashboards for managing partners, and a Practice Dashboards set that is replicated by location. When AMP onboards a new brand, the practice dashboards are copied from a template and pointed at the new centers.
AMP defined a focused set of operating and financial KPIs for every brand: average patient ticket, sales per service hour, provider utilization, percent new patients, percent retail revenue, wages as a percent of sales, and collections against monthly goal.
The same definitions carry through the dashboards, from the practice manager’s view to the executive summary. A number discussed in a pod review matches what a practice manager saw that morning. The resulting operating and financial dashboards are standardized across brands and designed to be straightforward to read.
AMP rolled out its Practice Dashboards by location with row level security. A practice manager logs in and sees their own center, or the two or three centers they cover, with no drop-down to work through. Managing partners see their pod. Corporate sees everything.
The set includes a PM Dashboard with collections, a Provider Dashboard, a Labor Dashboard, Schedule Optimization, Retail Opportunity, Paid Media, a monthly tracker and re-engagement lists. Practice manager training now runs through these boards, and automated snapshot emails deliver key numbers directly to managers' inboxes.
Ad platform spend, Liine and CallRail lead records, HubSpot contacts and GA4 sessions are stitched to Zenoti guests and invoices inside the HIPAA-compliant warehouse, so AMP can trace a campaign all the way to the patients and revenue it produced. That per-brand, per-location view is how corporate decides where to scale demand up or down, and how it tracks ramp at new locations.
Kieren uses AskCorral, CorralData’s AI agent, as a working tool. He can ask for collections by location since a given date instead of building the query himself. In one session, he asked where moving patients to a different provider might improve schedules and wages as a percent of sales. That question became the basis for AMP’s Schedule Optimization board.
AMP’s next step is to establish a set of questions that every practice manager asks on designated days, giving managers a consistent, data-based way to decide where to act.
With Rippling worker and pay data alongside Zenoti schedules and sales, AMP tracks wages as a percent of sales and provider utilization by location, giving teams a chance to adjust hours before the month closes. A Forecast Board projects revenue against goals. Two additional boards address questions corporate raises in pod reviews: Injector Ramp and Consultation, and Same Store Sales Growth and Lapsed Client Analysis.
Results
AMP now runs a platform spanning 20+ brands on one warehouse, and it did so without hiring data engineers. Corporate reviews every practice against the same KPI set, practice managers open a dashboard scoped to their own location, and new brands are added using a template rather than rebuilding their dashboards from scratch.
On the marketing side, AMP lowered its cost to acquire new patients while growing new patient revenue, and it can see patient lifetime value, lifecycle behavior and monthly forecasts by practice, all while remaining HIPAA compliant.
Day to day, the change is accountability. Utilization, labor efficiency metrics and collections against goal are reviewed regularly with each pod, and a practice that is tracking below its utilization target adjusts schedules before the month ends rather than after. Kieren, a constant user of the platform himself, has moved from building reports for practices to setting the questions they answer themselves.
"CorralData has become an essential partner in our mission to hyperscale Advanced MedAesthetic Partners. As a multi-brand, multi-location organization, understanding and optimizing performance across dozens of practices was once incredibly challenging."
CorralData connects EMR and POS systems, CRM and lead-tracking tools, ad platforms, accounting systems, payroll and HR systems, and inventory platforms, more than 600 data sources in total. Everything flows into one HIPAA-compliant data warehouse that refreshes automatically.
CorralData connects a new practice's own EMR, point-of-sale, and all other systems into the same governed data model rather than requiring it to switch platforms first. Its data is mapped to the organization's established metric definitions, so it can be brought into consolidated reporting without rebuilding the reporting foundation from scratch.
There is no fixed list. If the data exists in a location's EMR, POS, or accounting system, CorralData can track it, trend it, and help a team optimize for it. Common examples include average patient ticket, provider utilization, wages as a percent of sales, collections against goal, cost per first appointment, and lifetime value to acquisition cost ratio. Any metric tied to a connected data source can be added.
AskCorral is CorralData's AI agent. Teams can ask business questions in plain English and AskCorral answers and provides recommendations based on their connected data. For example, someone might ask which locations are running below target on provider utilization or wages as a percent of sales this month, and AskCorral can flag where to adjust staffing or scheduling. Conversations with AskCorral reveal where a team needs to intervene, opportunities to capture, and actions to take. Beyond answering questions, AskCorral can build and modify dashboards and widgets, so teams never have to wait for someone to build new reports.
CorralData works with each customer to establish shared definitions for its core metrics, instead of recalculating them differently for every practice or report. Those definitions live in a governed Data Dictionary backed by verified datasets, so a number reviewed at the practice level matches what's reviewed at the corporate level. When a new practice joins, its data maps to those existing definitions rather than introducing a new version of every metric.
Keep reading
Make your data work for you. Book a demo today to see CorralData in action.
" alt="">