


Executive Insights
Alex Lirtsman
Use AI to effortlessly answer any business questions from all your data.
Harness the power of AI without compromising on security.
Pair CorralData’s intuitive platform with our on-demand data team to take your insights even further.
Effortlessly integrate data without engineering expertise using 500+ prebuilt integrations.
Send relevant data to all of your platforms with our fully-managed Reverse ETL and drive results faster.
Help your clients become data driven faster through seamless reporting and collaboration tools.
Grow your census and strengthen your bottom line with HIPAA-compliant analytics.
Turn data into success with complete visibility of every consumer interaction.
Make data-driven decisions that enhance patient care and your bottom line.
Use HIPAA-compliant AI to optimize every part of your med spa business.
Unlock scalable growth across every portfolio company with AI.
Easily surface the data you need to increase sales and drive revenue.
See how AMP scaled profitability and enhanced patient care
See how AMNH gained a better understanding of the ‘why’ behind their data
See how Bell Curve provided their clients with consolidated and tailored reporting
See how BodyLase unlocked full data visibility, enabling smarter marketing and stronger results
See how evolvetogether used AI-powered insights to shape a unified growth strategy
See how Geode Health unlocked the value of their data while protecting patient privacy
See how Engine identified and converted more high-value customers
See how Lacoste boosted their e-commerce performance with AI-driven insights
See how Moon Juice used live insights to find, reach, and convert their best customers
See how Pfizer turned complex data into real-time marketing intelligence
See how Ready Set Rocket streamlined client reporting and unlocked real-time insights
See how Schwarzman Scholars streamlined global campaign tracking to unlock faster insights and smarter recruitment
See how St. John Knits increased marketing efficiency by 50%
See how sweetgreen acquired new customers and built stronger relationships with their most loyal patrons

CorralData
Scaling a MedSpa isn’t just about being booked solid — it’s about building a business that runs like a machine: profitable, predictable, and primed for expansion.
But here’s the truth: most operators are flying blind. They’re looking at topline revenue or Instagram likes and thinking they’re winning. Meanwhile, margin erosion, client churn, and inefficient scheduling are quietly eating into profits. The MedSpas that scale sustainably? They track what actually moves the needle.
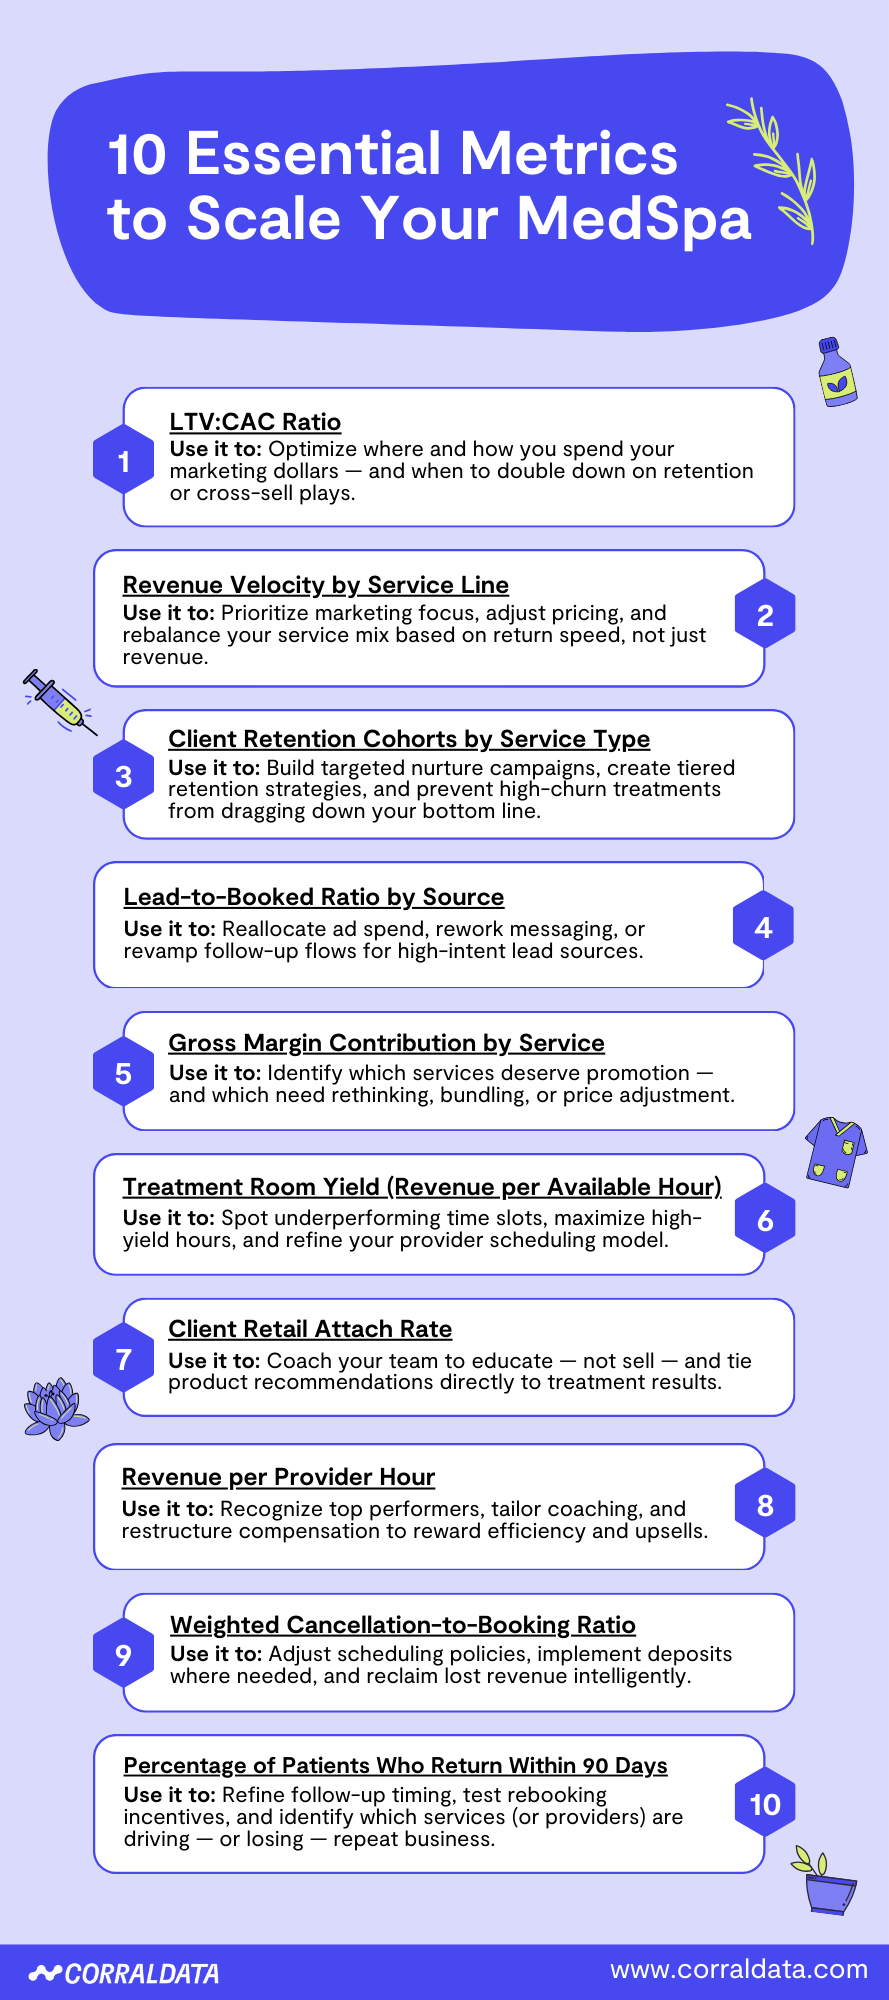
Here are the 10 next-level metrics the smartest owners use to grow with intention — and how you can use them to lead with clarity, not guesswork.
The easiest way to sink a medspa is to overspend on marketing and underdeliver on retention. Your LTV:CAC ratio (client lifetime value to customer acquisition cost) shows whether your marketing engine is building long-term value, or bleeding cash.
Healthy benchmark: 3:1 or better. If you’re spending $200 to acquire a client who only spends $300 total, you’re breaking even at best. But if they stay for 4 treatments and buy skincare? That same client could be worth $1,200.
👉 Use it to: Optimize where and how you spend your marketing dollars — and when to double down on retention or cross-sell plays.
Some services bring in big dollars, but book slowly. Others have low margins but fast turnover. Revenue velocity tells you how quickly each service line translates time and resources into actual cash flow.
Think: Botox that books 6x a day vs. body sculpting that fills one slot but eats up 90 minutes.
👉 Use it to: Prioritize marketing focus, adjust pricing, and rebalance your service mix based on return speed, not just revenue.
Generic retention rates hide what really matters. Break your clients into cohorts based on their first treatment type. Do your facial clients come back? Do your injectable clients convert into membership?
Loyalty is earned differently across services. Understanding behavior by entry point lets you engineer smarter journeys.
👉 Use it to: Build targeted nurture campaigns, create tiered retention strategies, and prevent high-churn treatments from dragging down your bottom line.
Traffic is cheap. Bookings are not. Track how many of your leads from each source (Instagram, ads, Google, referrals) actually convert into paying clients.
If paid ads drive 100 leads but only 5 book, while referrals convert at 30%, it’s not just a numbers game — it’s a signal problem.
👉 Use it to: Reallocate ad spend, rework messaging, or revamp follow-up flows for high-intent lead sources.
Revenue is seductive. But some services that look great on paper don’t contribute meaningfully to your overall profitability. Gross margin contribution shows how each treatment helps (or hurts) your business’s financial foundation.
Example: A $1,000 service that nets $200 after costs may be less valuable than a $400 treatment with an 80% margin you can book four times a day.
👉 Use it to: Identify which services deserve promotion — and which need rethinking, bundling, or price adjustment.
Your rooms are revenue engines. But how much are they actually producing per hour of availability?
A 90% utilized room doesn’t matter if it’s filled with low-margin, high-labor treatments. Revenue per available hour shows you true efficiency.
👉 Use it to: Spot underperforming time slots, maximize high-yield hours, and refine your provider scheduling model.
Retail isn’t about inventory — it’s about extending outcomes. Track how often service clients also purchase at-home care or supplements.
Low attach rate? That’s a training issue, not a sales one.
👉 Use it to: Coach your team to educate — not sell — and tie product recommendations directly to treatment results.
It’s not just who’s busy — it’s who’s profitable. Measuring revenue per provider hour gives you a true apples-to-apples look at your team’s output.
A part-timer might outperform a full-time provider once you control for hours worked and service mix.
👉 Use it to: Recognize top performers, tailor coaching, and restructure compensation to reward efficiency and upsells.
Tracking no-shows isn’t enough. A canceled $700 filler is not the same as a missed $100 facial. Segment cancellations by service and lead source — then weight by revenue value.
Are Instagram leads more likely to flake? Are cancellations higher on Mondays? This metric will tell you.
👉 Use it to: Adjust scheduling policies, implement deposits where needed, and reclaim lost revenue intelligently.
First visits are easy. Second visits are everything.
Tracking the percentage of clients who return for another service within 90 days gives you a real-time pulse on the health of your client journey. It’s one of the most predictive metrics for long-term loyalty — if a client hasn’t rebooked by day 91, chances are, they never will.
A 60%+ return rate within 90 days? You’re likely nailing your post-visit experience. Below 40%? There’s likely a breakdown in follow-up, satisfaction, or perceived value.
👉 Use it to: Refine follow-up timing, test rebooking incentives, and identify which services (or providers) are driving — or losing — repeat business.
Knowing your numbers is one thing. But growth comes from turning those insights into strategy, and turning strategy into consistent action.
You don’t need to track everything. You need to track what matters. And more importantly: you need to respond. Review these 10 metrics monthly. Build reports you’ll actually read. And let your data shape your next bold move — not your best guess.
Ready to start scaling faster? Download the below infographic and share with your team, or click here to Book a Demo and learn more about CorralData’s offerings.

CorralData