




 " alt="">
















The State of Aesthetics: H1 2026
100+ aesthetics brands, including most of the sector’s roll-ups. More than half a billion dollars of first-half revenue: the largest connected operator dataset in medical aesthetics, measured across 54 dimensions, from cohort retention and unit pricing to forward bookings, with 23 published in the benchmark table below. All brands anonymized.
Unlock the full report
This is the complete State of Aesthetics: H1 2026 benchmark, covering 100+ anonymized brands across 54 measured dimensions. Tell us where to send it and the report unlocks immediately below; we'll also email you a copy.
Start here
Three trends shaped the first half
Topline growth does not guarantee margin. Revenue per service hour spans $300 to $1,400+ across the middle of the cohort — same topline, half the staff cost. Productivity is the P&L lens worth checking before growth.
Executive summary
Ten findings that define the half
- The cohort grew +27.7% revenue-weighted (+19.2% at the median brand owner), roughly five times the industry baseline. Locations representing 82% of the cohort grew; the largest tier (47% of locations) grew 20–50%.
- Growth is barely about acquisition. Median new-customer growth was just +1.2% against +19.2% revenue growth. These brands grew revenue far faster than they added new patients: wallet share, not new faces.
- The median brand grew by deepening, not by adding doors. Its footprint held flat; the door growth that did happen was concentrated in a few aggressive operators, largely via acquisition rather than de-novo openings.
- Wellness-led brands (more than 30% of revenue from weight-loss, hormone, or IV services) grew 2.4× faster than pure aesthetics (+46.3% vs +19.2% median), but drove the cohort's first sustained wellness revenue dip in June.
- Revenue per service hour spans $300 to $1,400+ across the middle of the cohort (median $575). Same topline, half the staff cost: productivity is the hidden P&L.
- Membership is the strongest lever measured: members spend 2.5× more and retain 35 percentage points better at the median, without a single exception at any brand running a program.
- Botox is a commodity at $12.23/unit (1.9× total spread). Retention economics vary ~1.4×. Brands differentiate on retention design, not price.
- A fast minority wins the calendar: the quickest responders answer new leads in under 13 minutes, while everyone else takes 4 hours to 24 days.
- Team AI adoption (team members actively querying the data, not just leadership) correlates with a 12-percentage-point growth premium (21.9% vs 9.8% median), and cohort usage grew 4.5× from Q1 to Q2.
- The forward book is splitting by size. Nearly 250,000 appointments are scheduled; the median brand owner's forward book is −3.2% vs last year, but 60% of comparable locations grew theirs: scale is winning the calendar.
Section 01 · Headline
The cohort grew 30%: five times the industry baseline
Three cuts of the same dataset, in declining breadth:
Against the most recent AmSpa industry baseline of roughly 6% annual growth, the median brand owner in this cohort is expanding at more than three times the industry rate, and the revenue-weighted cohort at five times. Scale is not the differentiator: the larger half of the cohort by revenue grew 19.2% at the median versus 18.5% for the smaller half, essentially the same. On a per-door basis, the median brand generates roughly $212K per location per month, nearly double the most recent AmSpa industry average of ~$117K/month; mid-period openings make that figure conservative.
Locations representing 82% of the comparable cohort grew. The single largest tier (47% of locations) sits in the 20–50% growth band, and another 12% grew more than 50%. The spread is enormous: from +138% (an early-stage skin-focused studio compounding off a small base) to −21% at the next-lowest comparable operator. One brand's −47.6% reading was excluded as a subscription-model migration artifact, not organic decline.
Section 02 · Archetypes
Three kinds of operator, three growth curves
Classifying the cohort by wellness share of revenue (GLP-1/weight-loss, hormone, IV therapy) produces three distinct operating models with materially different H1 trajectories:
Pure aesthetics
57% of the cohort's locations, <5% wellness revenue. Injectable-led, membership-driven. Steady compounding; untouched by GLP-1 volatility.
Wellness-integrated
15% of the cohort's locations, 5–30% wellness revenue. Aesthetics core with a weight-loss/hormone line attached. Growth tracks the pure cohort.
Wellness-led
28% of the cohort's locations, >30% wellness revenue (up to 97–99% at one clinic). Fastest growing, and the source of all GLP-1 downside risk in this cohort.
The wellness-led premium is real but concentrated: it comes with recurring-visit economics (the highest cohort retention in the dataset: 80%+ of new clients return within 90 days at the top clinics) and with exposure. Every brand that drove the June wellness dip in Section 05 sits in this archetype.
A fourth pattern sits outside this wellness-share framework entirely: a handful of cohort brands run consult-led, surgical or body-contouring-heavy models rather than an injectable-flywheel or wellness-recurring one: longer sales cycles, higher tickets, more financing dependence. Too few brands in this cohort to quantify a growth curve for the group with any confidence, but the operating pattern is different enough from the three archetypes above that it's worth naming on its own rather than folding into "pure aesthetics."
Section 03 · The acquisition paradox
Revenue is growing. New-patient counts are not.
The median brand owner's new-customer growth was just +1.2% against +19.2% revenue growth: the cohort grew revenue far faster than it added new patients. The median brand books 29.6% of revenue from first-time clients; the rest is wallet share: return visits, bigger tickets, memberships, and treatment-plan depth.
The depth mechanics are visible across the funnel: the median client makes 2.3 visits per half at a median 26 days between visits, 69% of completed visits have the next appointment booked within 90 days, and the median ticket is $424. Meanwhile 43.9% of H1 clients visited exactly once: the single largest untapped pool in the dataset.
How much is that pool worth? One brand in the cohort offers a clean worked example: its single-visit clients (975 of them, all-time) spent an average of $355 in H1 versus $1,681 for repeat clients: a $1,326 gap per client. If a quarter of those single-visit clients converted to repeat-average spend, that's roughly $323K recoverable in H1 alone, about 2% of that brand's H1 revenue. This is one brand's math, not a cohort average (single-visit share and the spend gap both vary by brand), but it's a template any operator can run on their own numbers.
Practices managing a year-round treatment plan rather than one-off visits see higher return rates and higher lifetime value per client — one of the clearest patterns Skytale sees advising operators across the cohort.
The brands still growing acquisition fast (+38% at the 75th percentile) are disproportionately early-stage or newly expanded; the mature brands grow by deepening.
But the headline growth number hides a split. For the typical brand, growth is genuinely same-store: footprint held roughly flat, and each existing location did more business — deepening, not just expanding. For the fastest-expanding operators it is not: existing sites kept growing too, just averaging 33 points behind a total number that ranged from +19% to +69%. Neither path is wrong; they just call for different plays.
Section 04 · Footprint
Growth came from deepening, not adding doors
The cohort's physical footprint grew 1.23× on average across brands year over year, consistent with the acquisition paradox: operators are deepening existing locations faster than they're adding new ones. The median brand's footprint was exactly flat.
Expansion was concentrated: a small set of aggressive multi-location operators (largely through acquisition and brand rollout rather than de-novo openings) drove most of the door growth, while the flat-footprint majority still grew revenue double digits. Growth in this industry is no longer synonymous with opening doors.
Section 05 · Service mix
Injectables carry 40% of the cohort's revenue
The median brand earns 42.5% of revenue from injectables, 12.0% from laser and energy devices, 8.3% from skincare and facials, and 1.7% from body contouring. The residual (nearly 30% at the median) is where brands actually differ: wellness programs, memberships, packages, procedures, and retail. Two brands with identical injectable shares can have entirely different margin structures depending on what fills that residual.
Section 06 · Wellness & GLP-1
Wellness revenue is up 41% in two years, and just hit its first wobble
Monthly weight-loss, hormone, and IV/wellness revenue across the cohort climbed from $7.3M/month (Jan 2024) to a peak of $12.6M in April 2026, then softened to $10.4M by June, the first sustained dip in the 30-month series. The GLP-1 compression thesis from our Q1 2026 report is now visible in this cohort's own trailing data.
Archetypes matter more than the average. The wellness-led clinics run 30–99% of revenue on these categories, while roughly a third of the cohort sells effectively none (verified zeros, not missing data). The pure-aesthetics brands were untouched by the June dip; the GLP-1-dependent brands drove all of it.
Skytale sees wellness increasingly as an acquisition channel, not just incremental revenue: patients on both wellness and aesthetic services retain roughly 2x better than aesthetics-only clients, and 60% of GLP-1 patients are new to the practice.
Section 07 · Productivity
Revenue per service hour: the hidden P&L
The cohort's signature productivity metric (H1 service revenue divided by completed service hours) spans $300 to $1,400+ across the meaningful range, with a median of $575/hour. Procedure-led and high-acuity brands clear $1,000; high-volume injectable chains run $300–600; the floor belongs to long-duration wellness appointment models.
Provider-level productivity tells the same story wider: H1 revenue per active provider runs from $60K to $598K (a 10× spread) with a median of $207K. Two brands with identical topline can require more than twice the staff cost. The gap decomposes into treatment planning, enhancement upsell, retail attach, room-turn time, and pricing power, which is why it resists quick fixes and compounds for the operators who manage it.
Staffing is the other half of the equation. Median provider-staff turnover ran 11.6% for the half, meaningful, but not the crisis the industry narrative suggests, even if a few brands mid-reorganization run past 30%. At a 10× productivity spread, who leaves matters far more than how many: losing a top provider costs a multiple of what the headcount implies.
Skytale frames this as a productivity problem more than a hiring one: compare providers only after normalizing for tenure, service mix, and product line. Raw comparisons often blame headcount for what’s really a training or scheduling gap.
Section 08 · Pricing & discounting
Botox is a commodity. Discounts are a choice.
Across the brands with true per-unit line items (roughly two-thirds of the cohort's locations), Botox pricing clusters tightly: $9.69–$18.88 per unit, median $12.23. Filler runs roughly $510–$730 per syringe by brand. A 1.9× total spread on the industry's anchor product (compared to 1.4–3.7× spreads on retention, productivity, and CAC) shows the market sets injectable prices, and operators build their economics everywhere else.
Discounting is where pricing discipline actually varies: the median brand gives up 13.2% of total gross revenue (across all services, not just injectables) to discounts, but the interquartile range runs from 6.9% to 21.2%, a wider band than any price card. The heaviest discounters are membership-benefit models where "discount" partially reflects prepaid economics; the leanest run under 3% without hurting growth. Refunds are a non-story at a median 1.3% of gross.
Whether heavier discounting buys faster growth doesn't hold up: on a 14-brand sample with clean discount and revenue-growth data, the correlation is weak: r = 0.235 (essentially no relationship). Two brands sit at the high-growth/high-discount end (100%+ growth alongside 25–32% discount rates), but two others break the pattern in the opposite direction, growing 7–87% on discount rates from 8% to 27%. Discounting doesn't look like a reliable growth lever in this data.
This matches what Skytale sees across its own client base: the strongest operators compete on outcomes and experience, not discount depth.
Supplier wallet share
Among brands with connected purchasing data (just over half the cohort's locations), the Allergan/AbbVie family holds the #1 wallet-share position at roughly 2 in 5 brands, with Galderma the clear challenger (about 1 in 4) and Merz, Evolus, and Revance splitting most of the remainder, consistent with the supplier positioning in our Q1 2026 report. Purchasing-data coverage is the thinnest in this dataset; full supplier economics are reserved for the companion report (Appendix B13).
Across the cohort, Botox prices vary 1.9× and member retention lift varies about 1.4×. Brands differentiate on retention design, not price.
Section 09 · Membership
Membership is the strongest economic lever in the dataset
Across every brand with a real program (over 90% of the cohort's locations), members outspend and outstay non-members without a single exception. The best programs are startling: one large multi-site chain retains members at 94.8% vs 59.6% for non-members; one single-site brand's members spend $1,957 vs $600 for non-members at 73% retention (gross H1 spend, not annualized).
Penetration, not program design, is where the portfolio actually differs: from under 3% of active clients to 84.6%. The under-penetrated half of the cohort is sitting on the most quantifiable growth lever this report measures: moving penetration from the bottom quarter of brands (6%) to the middle of the pack (18%) at median member economics is worth several percentage points of annual revenue growth with no new patient acquisition at all.
The takeaway for the under-penetrated half of the cohort isn't to redesign the program: it's to sell it. Membership is the most quantifiable growth lever this report measures, and most operators are leaving it on the table.
Section 10 · Retention & cohorts
The median 2025 cohort: 46% come back within three months
Measured on 2025 acquisition cohorts we could track for a full 90 days, the median brand brings 45.8% of new clients back within 90 days, ranging from 22% to 86.5%. Recurring-visit wellness models dominate the top of that range (80%+); one-and-done treatment mixes sit at the bottom. Aesthetics brands cluster between 35% and 55%, and the difference between those two numbers, compounded over a year, is most of the difference between the cohort's growth leaders and laggards.
| Retention measure | P25 | Median | P75 |
|---|---|---|---|
| New-cohort return within 3 months (2025 cohorts) | 36% | 45.8% | 62% |
| Repeat rate within 90 days (H1 clients) | 45.5% | 54.1% | 59.2% |
| Rebooking within 90 days of a visit | 58.1% | 69.0% | 73.3% |
| H1 2025 clients returning in H1 2026 | 37.7% | 46.4% | 53.5% |
| Clients lost from H2 2025 (churn) | 37.6% | 43.5% | 47.6% |
| Single-visit share of H1 clients | 38.9% | 43.9% | 51.4% |
| Avg completed visits per active client | 2.0 | 2.3 | 2.8 |
Client concentration adds a quiet risk dimension: the median brand earns 39.7% of revenue from its top 10% of clients (up to 66% at the extreme). High concentration plus low cohort retention is the most fragile profile in the dataset; several brands carry both.
Section 11 · Marketing efficiency
CAC spans $4 to $717, and the channel split moved to 50/50
Median blended CAC is $68 against a median lifetime value of $2,339, a median LTV:CAC of 34. The distribution is the story: injectable chains with organic and referral flywheels acquire below $35, while consult-led brands (surgical or body-contouring practices with longer sales cycles) pay $400–700 per new patient and earn it back on ticket size. A minority of the cohort cannot compute CAC at all (no connected spend source), and, consistent with the Q1 finding, brands with zero marketing-spend visibility cluster in the bottom growth quartile.
Across $10.5M of tracked H1 paid media, spend split 50% Meta / 50% Google, compared to a 59%/41% Meta split in the Q1 cohort. Efficiency still diverges by channel and brand: at one wellness platform, Meta leads cost $32 against $142 on Google for the same clinic; at consult-led brands the ratio can invert. Which channel you lean on can swing efficiency up to 4×, yet most operators set the mix once and stop measuring.
Section 12 · Lead funnel & speed
Answer faster, book more patients
How fast you call a new lead back matters more than almost anything else in your funnel. Where we can measure lead-level detail (about three-quarters of the cohort's locations), the median brand turns 43% of leads into patients, though that ranges from 6% to 92% depending on how loosely each CRM counts a "lead." The number that matters more is response time. A fast group of brands calls new leads back in under 13 minutes, and two respond in under 20 seconds: that's automation, not heroic staff. Everyone else takes anywhere from 4 hours to 24 days.
For comparison, industry benchmarks outside this cohort (see our Q1 2026 report) put typical lead-to-booking conversion near ~20% and typical response time at 8–24 hours. This cohort converts at roughly double that rate, and its fastest brands respond about 1,000x faster than the industry norm.
Booking habits matter too: the median brand books appointments 21 days out and takes only 10.2% of bookings online; most patients still book by phone, which is harder to track and easier to fumble. The pattern holds without exception: brands that answer new leads in under 15 minutes and take more than 30% of bookings online sit in the top half of the growth table.
Real numbers from one brand in the cohort make the stakes concrete: leads it called back right away ended in a booked or promised appointment 61.4% of the time (824 leads, H1 2026), versus 58.2% when a lead needed a second, later call to reach (279 leads); those redial calls also ran longer, averaging 5.5 minutes versus 4.6 minutes. The gap is modest at any single practice, but it repeats every day, at every location.
Section 13 · No-show economics
$24M of booked value walked out the door
Across the cohort, no-shows carried an estimated $23.6M of gross booked value in H1, a median of 1.7% of revenue, but with a heavy tail: two high-acuity brands account for over half the total, because a missed consult or procedure slot books $800+. Best-in-class operators hold no-show leakage under 0.35% of revenue with deposit policies and automated confirmation cadences.
That dollar figure undersells the size of the problem on the calendar itself. Measured against booked appointments rather than revenue, no-shows and cancellations together consume a median of 15.82% of the calendar across the 34 cohort brands with appointment-level detail, and cancellations, not no-shows, drive most of that share. Fixing the no-show fee alone addresses only a fraction of the lost calendar time.
Recovery is nearly nonexistent: only a minority of brands charge no-show fees at all, and where measured, fees recover under 20% of the lost value. The economics favor prevention: the median brand's no-show leakage is roughly the margin of a full additional provider-week per month.
The prevention playbook is well established: state a clear late-cancel and no-show fee at the time of booking, keep an active waitlist to backfill openings, make rescheduling a single tap so patients reschedule instead of ghosting, and give the highest-value consult and procedure slots the tightest follow-up and a personal touch: one miss there costs the most.
Section 14 · Patient financing
Patient financing is a high-ticket conversion lever, not a payment shift
Patient financing (Cherry, CareCredit, Affirm and peers) carries a median of just 4.2% of payment volume, significant at consult-led, high-ticket brands (15–25%) and marginal everywhere else. Card rails dominate the rest. What financing actually does is remove the upfront-cost barrier on expensive treatments, so it lifts case acceptance and conversion at the top of the ticket distribution, an opportunity the high-ticket brands not yet offering it are leaving on the table.
Section 15 · Beyond dashboards
Brands where AI adoption spread across the team grew 8 percentage points faster, and usage quadrupled in Q2
The breadth signal from the Q1 report replicates in this cohort: brands where multiple team members query their data directly grew 12 percentage points faster at the median than brands where nobody (or a single analyst) does. Adoption itself inflected sharply in Q2: usage grew 4.5× quarter over quarter as location managers, front-desk leads, and marketing coordinators came online alongside owners; the data stopped being an analyst's artifact and became the operating floor's shared surface. Weighted by revenue, the adopted group grew +29.0% against +21.3%: the premium holds however the cohort is cut.
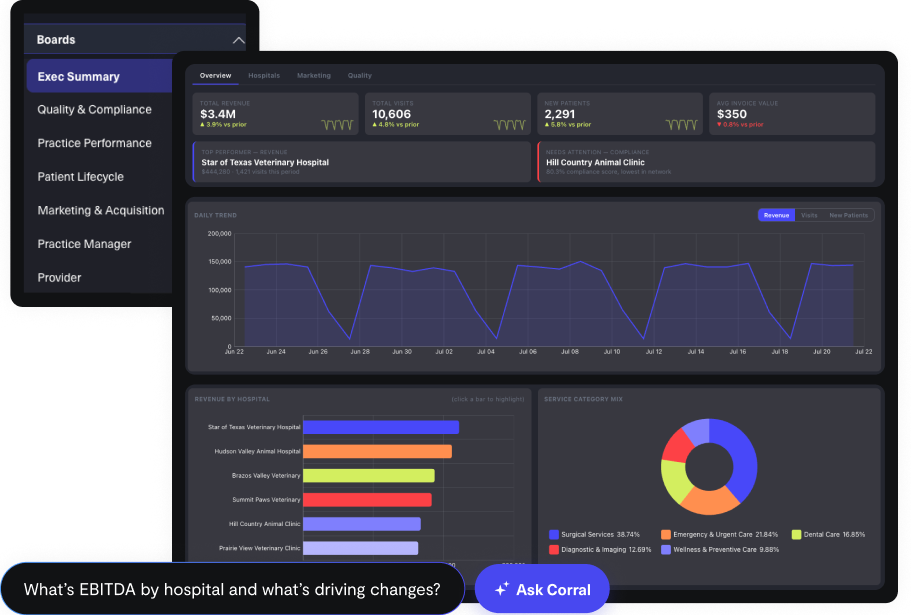
Underneath the adoption curve sits a platform shift. In late January, AskCorral's agentic mode went live: a multi-step agent that plans, queries, verifies, and builds, reachable both in-app and from outside tools like Claude. Within a single quarter it became the dominant way this cohort touches its data, while legacy one-shot search modes collapsed to near zero. The questions on the wall above are agent-mode questions: they get answered with reasoning chains and follow-through, not a single chart.
Beyond dashboards: predict, model, act
What changed in Q2 is the mode of use, not just the volume. The top operators have moved past the dashboard era entirely. A templated report only answers the questions a reporting vendor picked in advance, for everyone at once, using the vendor's definition of every metric, whether or not it fits how your business runs. These operators ask their own questions, computed with their own definitions, bespoke to their service menu, their providers, their market, this week. These are real questions operators asked in Q2, verbatim from the query logs (names and places redacted):
Read the list again and notice what's not on it: nobody is asking for a report. No two of these questions would fit the same template, which is precisely why templated reporting can't produce them. These are operating decisions in question form (capacity to fill this week, a promo to kill or scale, a provider conversation to have, a cohort to win back, a what-if to price) and they escalate through three modes the canned-report world doesn't have: predict (break-even rebooking lift, forward-book trajectory), model (what if we exclude packages? what's a healthy MER on new-patient revenue only?), and act; acting doesn't mean a human re-reading a PDF. Through reverse ETL, the answer flows back into the systems that do the work: the never-rebooked winback list syncs into the CRM's follow-up cadence, high-value patient segments sync into Google and Meta as audiences, the empty-slot count reaches the schedule. The data doesn't stop at insight; it ships.
Every brand in this report can ask its business anything, model any scenario, and pipe the answer straight into its CRM and ad platforms. A canned dashboard from a reporting vendor shows their template, not your business, a month behind. The 12-percentage-point gap is your trajectory.
Section 16 · Forward view
Nearly 250,000 appointments on the books: a forward book that splits by scale
As of the first week of July, the cohort holds nearly 250,000 scheduled appointments. Where a year-over-year comparison is possible (over nine-tenths of the cohort), the picture splits: the median brand owner's forward book is −3.2% versus this time last year, but 60% of comparable locations grew their forward book, because the larger multi-location platforms are the ones building calendar. Scale is winning the forward book while the median independent softens.
Two readings are consistent with the data. The bearish one: demand cooling off after two extraordinary years, showing up first at smaller operators. The benign one: booking windows are shortening (the median lead time is already down to 21 days), so a same-size business simply holds fewer future appointments at any moment. Distinguishing the two is the single most important measurement task for Q3, and the strongest argument in this dataset for watching forward bookings weekly rather than reading revenue monthly. One caveat worth holding onto: H1 ends in June, and this dataset can't yet rule out a seasonal compression in booking lead times heading into summer: a same-store, non-acquisition brand in a related CorralData analysis showed lead times shortening into June two years running, which would mechanically lower a forward-book snapshot without reflecting weaker demand.
Section 17 · What the outperformers do
Six habits of the top quartile — and how to build them
Each ties to a lever already in this report. For each: the move, and the number to watch monthly to know it is working.
These are not a separate checklist; they are how top-quartile brands put the eleven findings above into practice, day to day.
- They run membership as the product, not a discount program: every top-quartile brand with a program shows a member retention lift of 25 percentage points or more, and penetration well above the 21% median. It's the strongest, most quantifiable lever in the dataset, so the direction is clear: sell it harder and grow penetration, starting with your highest-frequency non-members. Watch monthly: membership penetration, and per-member spend vs. non-member.
- They answer leads in minutes. Every sub-15-minute responder sits in the top half of the growth table; two automated their first touch entirely. Speed is the lever: reduce lead response time by automating first-touch and routing new leads to an owner the moment they come in. Watch monthly: median first-response time.
- They protect the calendar. Top-quartile no-show leakage runs under 0.5% of revenue; bottom quartile runs 3%+. Because no-show fees recover little once a slot is missed, prevention is what protects the calendar: a deposit or card on file at booking, plus an automated confirmation cadence. Watch monthly: no-show leakage as % of revenue.
- They know their LTV:CAC. Brands with no marketing-spend visibility at all cluster in the bottom growth quartile: visibility precedes efficiency. Connect every spend source first, then judge acquisition on the quality of the patient (LTV), not the size of the CAC. Watch monthly: LTV:CAC by channel.
- They grow wallet share deliberately: rebooking above 75%, 2.5+ visits per client, and single-visit share pushed below 35%, rather than chasing new-patient volume at rising CACs. With single-visit share near 44% of patients cohort-wide, winning that second visit is the cheapest revenue available; make rebooking the default before the patient leaves the chair. Watch monthly: rebooking rate, single-visit share.
- Their teams work in the data daily (predict, model, act), not in canned reports monthly. Team-wide use of the data to forecast, run what-ifs, and push segments back into CRM and ad platforms correlates with a 12-percentage-point growth premium; the pattern is breadth of adoption, not a single power user with a report login. Put the whole team in the data, not just one analyst. Watch monthly: % of team leveraging AI capabilities, not just leadership.
None of these habits requires scale, and none is secret. What they share is a prerequisite: you cannot run a habit you cannot measure. Every brand in this cohort sees its rebooking rates, member economics, no-show leakage, forward book, and LTV:CAC in one place, daily. The compounding math is unforgiving: a 12-percentage-point annual growth gap makes one operator materially larger than an identical competitor within four years. In H1 2026, these operators grew five times faster than the industry, tracked it themselves instantly, and adjusted as they went.
FAQ
Questions operators and investors ask
How fast is the medical aesthetics industry growing in 2026?
Is the GLP-1 boom over for med spas?
What is a good revenue per service hour for a med spa?
What should a med spa membership program achieve?
What does a new patient cost in 2026?
How much does slow lead response actually cost?
Are no-show fees worth charging?
Does AI adoption actually correlate with growth?
What does the forward book say about Q3 2026?
Who is in this cohort?
Appendix A · Benchmark table
H1 2026 benchmarks
| Metric | P25 | Median | P75 | Coverage |
|---|---|---|---|---|
| H1 revenue per brand owner | $3.47M | $10.22M | $21.71M | 100% |
| Revenue per location | $0.67M | $1.23M | $1.86M | 100% |
| Revenue growth YoY | +7.6% | +19.2% | +44.8% | 94% |
| New-customer growth YoY | −15.7% | +1.2% | +38.2% | 97% |
| Avg transaction value | $339 | $413 | $492 | 100% |
| Lifetime value | $1,534 | $2,287 | $3,200 | 100% |
| CAC | $33 | $68 | $123 | 82% |
| Revenue per service hour | $360 | $575 | $839 | 100% |
| Revenue per provider (H1) | $126K | $206K | $255K | 97% |
| 90-day repeat rate | 45.5% | 54.1% | 59.2% | 100% |
| Rebooking within 90 days | 57.8% | 68.3% | 72.9% | 88% |
| Visits per active client | 2.0 | 2.3 | 2.8 | 100% |
| Membership penetration | 6.8% | 18.0% | 46.4% | 88% |
| Member spend multiple | 1.8× | 2.5× | 2.8× | 88% |
| Member retention lift | +27pts | +35pts | +38pts | 85% |
| Discount rate | 7.9% | 13.2% | 19.2% | 100% |
| Refund rate | 0.4% | 1.2% | 1.8% | 100% |
| Appointment completion | 74.7% | 80.7% | 85.3% | 97% |
| No-show loss, % of revenue | 0.9% | 1.7% | 3.1% | 100% |
| Botox price per unit | $11.40 | $12.20 | $12.80 | 65% |
| Top-decile client revenue share | 35.2% | 39.3% | 44.7% | 97% |
| Footprint multiple YoY | 1.00× | 1.00× | 1.33× | 97% |
| Forward bookings YoY | −22.1% | −3.2% | +39.6% | 82% |
Percentiles are computed per brand owner (each multi-location platform contributes one observation, so large chains don't dominate the distribution); the Coverage column shows the share of the cohort's locations belonging to brands where a metric can actually be measured.
Interactive · Benchmark yourself
Where would your practice rank?
Enter any numbers you know; every field is optional. Your position is computed against the actual distribution behind this report, right here in your browser.
Computed locally in your browser: nothing you type is uploaded, stored, or sent anywhere.
Appendix B · Methodology
How this was measured
B1 · Cohort composition
100+ aesthetics brands across roughly 500 locations on the CorralData platform, spanning single-site clinics to multi-state, multi-brand platforms; H1 2026 revenue from under $1M to over $50M per brand owner, nearly half a billion dollars combined. On a 35-brand sample with verified H1 revenue, the distribution skews toward the middle: under $2M (3 brands), $2–10M (14), $10–30M (13), $30M+ (5). Disaggregating multi-brand roll-ups into their acquired sub-brands puts the location-count distribution, on a 72-brand cohort view, at 1–5 locations (53 brands), 6–20 (13), and 21+ (6), a different lens than the 100+ brand / ~500 location figures above, which count each roll-up as a single brand. Mix of pure aesthetics, hybrid, wellness-led, and telehealth models. Excludes behavioral health, dermatology-only, and non-aesthetics operators.
B2 · Data sources
Practice-management revenue on an accrual basis (Zenoti, ModMed, Aesthetic Record, Nextech, e-commerce platforms), ad platforms (Google, Meta, TikTok), CRMs (GoHighLevel, HubSpot, Salesforce), and accounting GLs (Sage Intacct, QuickBooks, and NetSuite-style ledgers) where connected. Primary comparison: H1 2026 vs H1 2025; wellness trend uses Jan 2024 – Jun 2026.
B3 · Definitions & normalization
Operators define operating rates differently (rebooking windows, retention cohorts, no-show denominators), and in daily platform use each brand runs its own definitions. For this benchmark, every metric was recomputed under one cohort-wide definition (stated per metric in this appendix and in table footnotes) so cross-brand comparisons are like-for-like. A brand's internally reported figure may therefore differ from its benchmark figure without either being wrong.
Median growth (+19.2%) is the midpoint of per-brand-owner YoY revenue growth across the comparable cohort (99% of locations). Revenue-weighted growth (+27.7%) weights each brand owner by H1 2026 revenue. The wellness-led figure (+46.3%) is the median of that archetype (28% of the cohort's locations). One brand owner's YoY comparison is cross-source due to a late-2025 system migration and is flagged accordingly.
"Consult-led" brands are defined by service mix, not ticket size: a majority-share of H1 revenue from surgical, body-contouring, or other high-touch consult-driven categories, as opposed to walk-in/injectable-flywheel models. This is the same categorization used for the CAC and financing splits elsewhere in this report.
This report uses the median, not the mean, as its default summary statistic throughout. The two diverge meaningfully in a right-skewed cohort: e.g. staff turnover's mean (14.4%) sits well above its median (11.6%), pulled up by a handful of small-provider-count brands with high turnover rates on a small base. The median is more representative of the typical brand and less sensitive to a few extreme outliers. That's also why every percentile table in Appendix A reports P25/median/P75 rather than a single average.
B4 · Anonymization
No brand, operator, or location names appear in this report. Geographic references are removed or coarsened; size descriptors are banded; unique-identifying metric combinations are reported as ranges or attributed to archetypes. Brand-level data underlying each figure is maintained internally with access controls.
B5 · Service-mix mapping
Each brand's own service categories were mapped into five standard buckets (injectables, laser/energy, skincare/facials, body contouring, other). Granularity varies by platform: complete for Zenoti-based brands, coarser for others; "other" absorbs wellness, procedure, retail, and membership revenue where line-item categories don't separate them.
B6 · Wellness measurement
Wellness revenue = item-level matches on GLP-1/weight-loss (semaglutide, tirzepatide, weight-loss programs), hormone/HRT/testosterone, and IV/wellness categories, verified per brand against the catalog before accepting zeros. PMS-billed only; brands billing GLP-1 through outside pharmacies or separate systems are understated.
B7 · Productivity method
Revenue per service hour = H1 service revenue (excluding retail/gift cards where separable) ÷ completed appointment hours from start/end times or duration fields. One brand uses provider-worked hours as denominator (no appointment durations exist in its platform); one uses service-catalog duration imputation for 22% of appointments; the telehealth brand reports $0 by construction. Revenue per provider = H1 revenue ÷ providers with completed appointments in H1.
B8 · Membership & retention method
Member economics compare clients holding an active membership against non-members within the same brand: H1 spend, visit counts, and retention (share of clients active in H2 2025 who returned in H1 2026). Cohort retention assigns each client to a first-purchase month and measures second-purchase timing in 1–3 and 4–6 month windows; only 2025 cohorts with complete windows feed the headline figure.
B9 · AI adoption telemetry
Measured from platform query logs: distinct non-staff users per brand owner issuing natural-language data queries, Q1 vs Q2 2026, complete through Jun 30. "Team-adopted" = 3+ distinct active users in H1. Staff and internal accounts excluded by email domain. Access-mode analysis uses the query-source enum in the platform's application logs; the agentic mode (in-app agent + MCP connections) is measured as one surface: the telemetry does not currently separate the two doors.
B10 · Footprint method
A location counts as active in a half-year if it has completed/paid activity (sales lines or completed appointments) in that period; head-office, online-store, training, and supply pseudo-locations are excluded (telehealth channels flagged where counted). Openings = first-ever activity in the last twelve months; closings = active in H1 2025 with zero H1 2026 activity. First-activity dates at acquired brands can reflect platform onboarding rather than de-novo openings; expansion figures therefore blend organic openings with M&A and are annotated per brand in the underlying data.
B11 · Forward-booking method
Future-dated appointments as of early July 2026 in scheduled (non-cancelled, non-completed) statuses, bucketed by service date. YoY comparison reconstructs the same measure for July 2025 using booking-creation timestamps where they exist (over nine-tenths of the cohort's locations). Several platforms cap forward visibility near 90 days; Q4+ counts understate accordingly.
B12 · Known limitations
- One brand reports in EUR; excluded from USD unit-price benchmarks.
- One brand's revenue covers five of six months (final month's GL unposted at extraction).
- One brand's ad spend is a lower bound (rolling-window ads table).
- One brand's raw warehouse froze mid-April; its figures come from curated pipelines verified current through early July.
- Two no-show estimates are gross-booked-value upper bounds (high-ticket consult averages; invoice-level averaging).
- Self-selection: platform customers skew tech-enabled; the ~6% industry baseline and the ~$117K/month per-location revenue norm are approximations from AmSpa's most recent State of the Industry reporting (americanmedspa.org).
- Every unavailable value in the underlying dataset is null with a stated reason; nothing is imputed.
B13 · Refresh cadence
This benchmark refreshes each quarter; forward-booking and AI-adoption panels refresh quarterly as well. A companion analysis on supplier economics and consumable costs is planned once purchasing-data coverage widens.
See your numbers next to this benchmark
Every stat in this report came from operators who connected their systems once and now ask their business anything, then push the answers into their CRM and ad platforms. Find out where you'd rank.
Book a Demo