Use AI to effortlessly answer any business questions from all your data.
CorralData MCP brings your business data and intelligence directly into Claude and other AI assistants
Build and share custom data applications powered by your connected data.
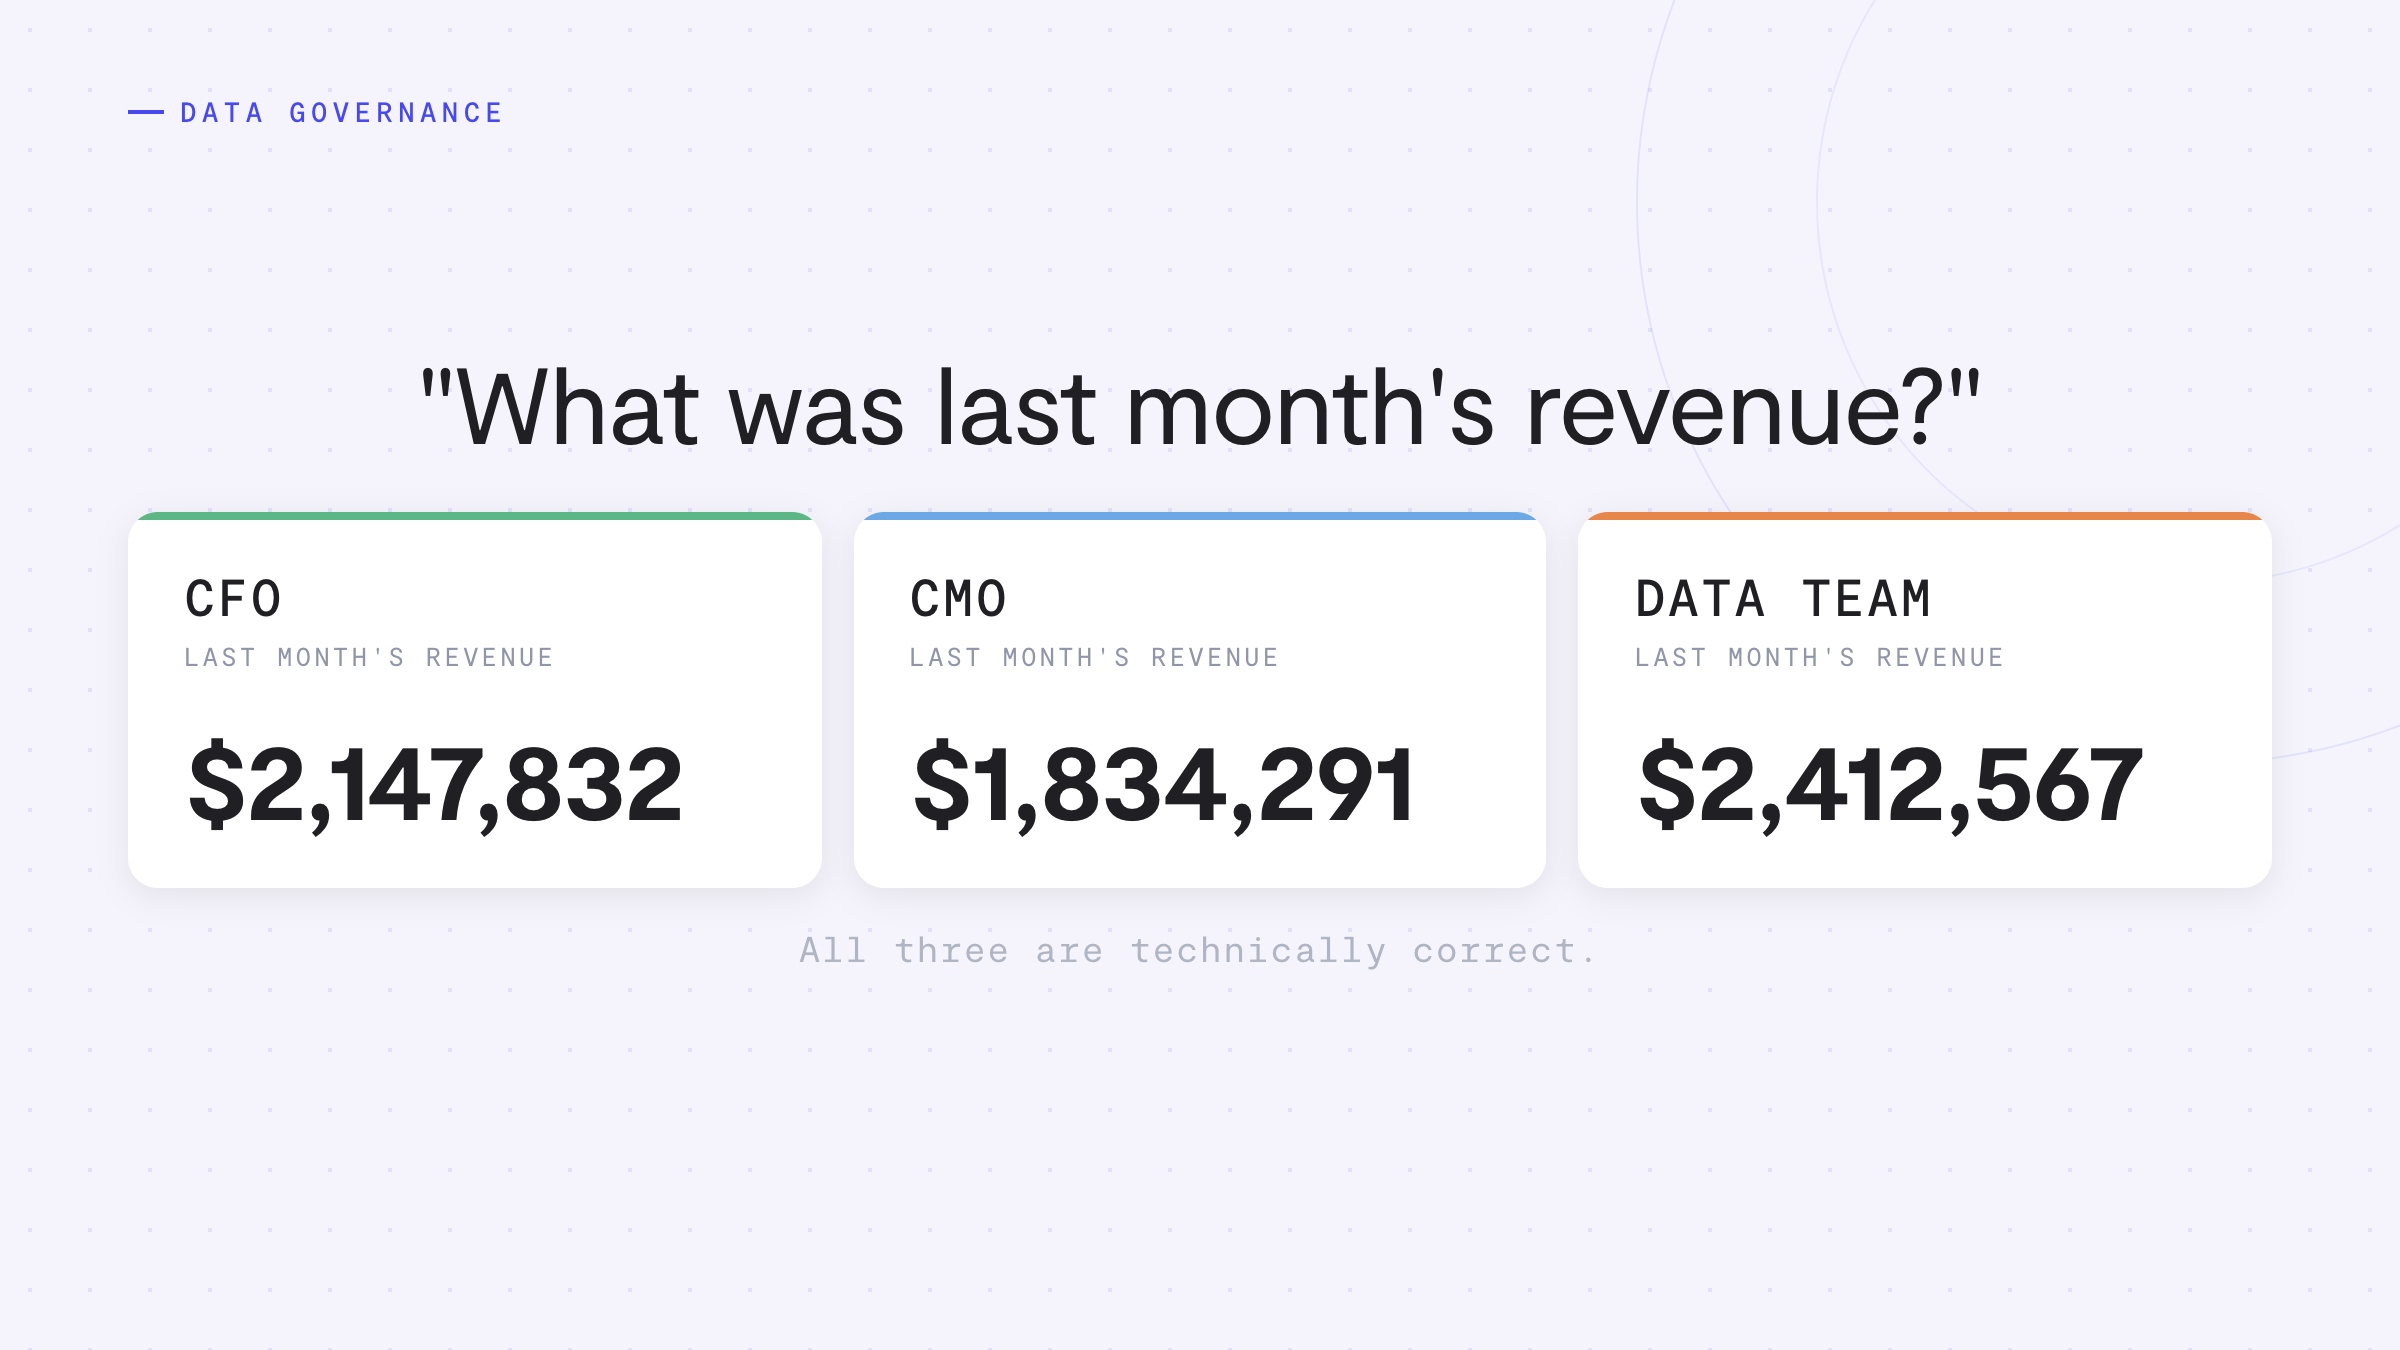
See where accuracy is won or lost across your data stack, and how a governed foundation changes the outcome.
Harness the power of AI without compromising on security.
A dedicated Technical Account Manager guides your team through it
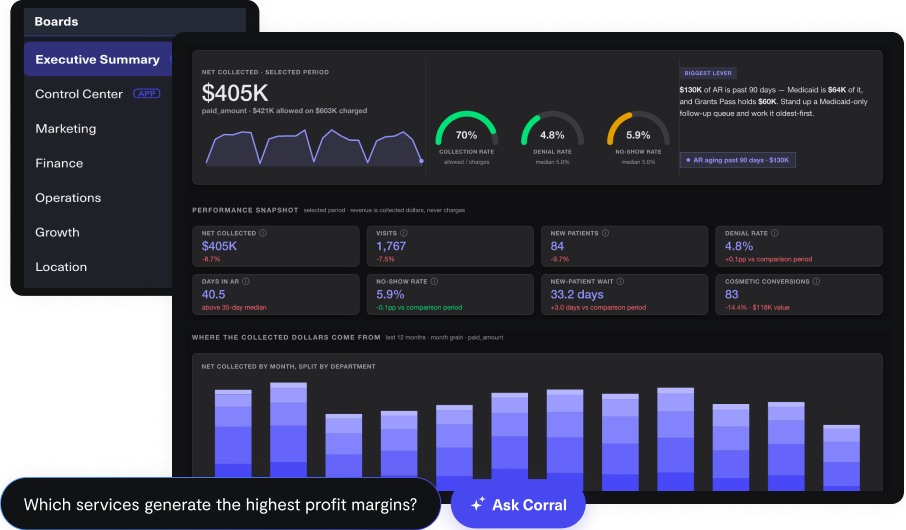
Turn any dashboard into a clear, actionable summary in just one click
AI agents detect opportunities in your data and sync them across your platforms with our fully-managed Reverse ETL.
Sync data from 600+ sources, align KPIs, and see portfolio-wide results instantly.
Give every role the same board, filtered to exactly what they're allowed to see.
Help your clients become data driven faster through seamless reporting and collaboration tools.
Grow your census and strengthen your bottom line with HIPAA-compliant analytics.
AI-powered analytics for dental practices and DSOs. Track production, case acceptance, patient recare, and marketing ROI.
See medical, Mohs, and cosmetic performance across every clinic in one place.
Turn data into success with complete visibility of every consumer interaction.
Make data-driven decisions that enhance patient care and your bottom line.
HIPAA-compliant AI agents that optimize operations, marketing, and patient care across every med spa location.
See four-wall performance for every clinic and surgery center in one place.
AI-powered analytics for plastic surgery practices. Track consult conversion, surgeon performance, and marketing ROI.
AI agents that monitor, analyze, and optimize performance across every portfolio company.
Easily surface the data you need to increase sales and drive revenue.
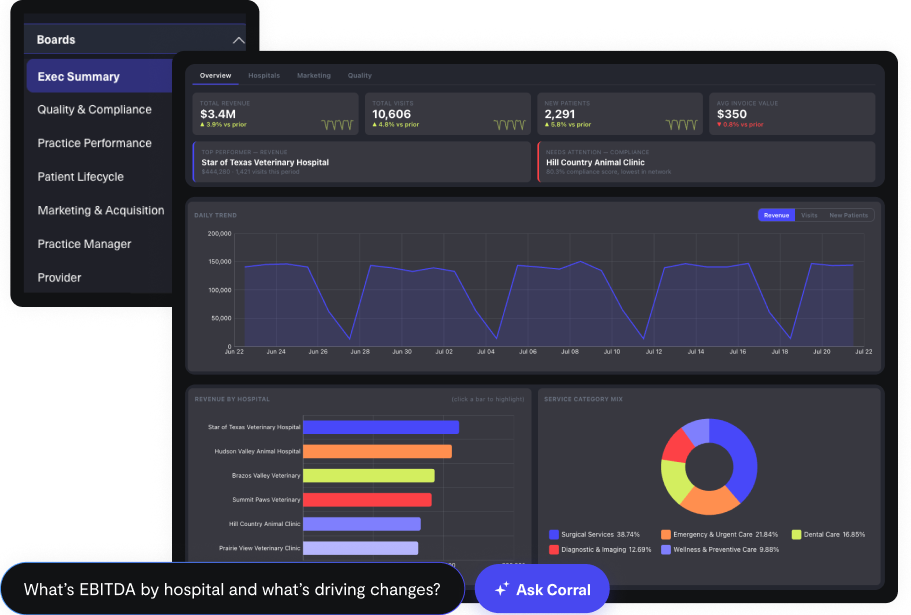
Measure every hospital the same way and track compliance across your whole group.
See how AMP scaled profitability and enhanced patient care
See how CorralData & Evolve Results built ADVENT a true ROI engine
See how AMNH gained a better understanding of the ‘why’ behind their data
See how BodyLase unlocked full data visibility, enabling smarter marketing and stronger results
See how evolvetogether used AI-powered insights to shape a unified growth strategy
See how Geode Health unlocked the value of their data while protecting patient privacy
See how Engine identified and converted more high-value customers
See how AI and unified data drove revenue growth at Inspire Aesthetics
See how Lacoste boosted their e-commerce performance with AI-driven insights
See how Moon Juice used live insights to find, reach, and convert their best customers
See how Olympus uses data and AI to fuel growth
See how Options Medical Weight Loss maximized their LTV:CAC
See how Pfizer turned complex data into actionable marketing intelligence
See how Ready Set Rocket streamlined client reporting and unlocked actionable insights
See how Solo Stove measures true channel ROAS with a marketing mix model in CorralData
See how St. John Knits increased marketing efficiency by 50%
See how sweetgreen acquired new customers and built stronger relationships with their most loyal patrons
Featured case study
Annie Aesthetic grows by acquiring established practices and keeping their brands. It now runs 14 brands across 22 locations, with services spanning injectables, biostimulators, device-based treatments, esthetics and functional health memberships. Every acquisition arrived with its own Zenoti instance, its own way of counting revenue and its own idea of what a strong provider looks like. Leadership needed to answer one question: how do you run acquired practices as one business when each of them measures itself differently?
Cerbo
Aesthetix CRM
MedvelleKey metrics
Challenge
Each brand Annie acquired could report on itself, but no two reported the same way. Some counted revenue on a cash basis and others on accrual. Injector-led brands measured success in average ticket, while the Functional Health line counted memberships sold. Body and Beauty Lab ran on separate Zenoti instances, and one brand ran on Cerbo instead. Device and product costs sat in Medvelle, compensation in BambooHR and financials in NetSuite, so commission reporting meant stitching those systems together.
Leadership could see any one brand but not the portfolio. It couldn't tell which brands were on budget and which were drifting, which providers had room on their schedules, or how rebooking compared brand to brand. The group was also still buying, and every new acquisition added another set of numbers that didn't line up with the rest.
Solution
CorralData connected a Zenoti schema for each brand and built a rollup that combines them with a standard center list and brand code. The first year went into making the numbers match how Annie actually operates. That meant an Executive Summary for the group, manager and provider views for each clinic, commission reporting and KPI goals loaded from Google Sheets. It also meant a Cerbo build for the brand that doesn't run on Zenoti, along with inventory and cost of goods reporting. Marketing systems followed, including Aesthetix CRM, Google Ads, Meta Ads and Google Analytics 4. Every definition is written down and maintained in a shared Data Dictionary, so anyone on the team can see exactly how a number is calculated.
Group leadership reviews all 14 brands side by side in the Executive Summary and an L10 scorecard, and every brand is reviewed against the same metrics in the same weekly meeting. A Sales vs Budget board shows each brand's distance to goal. Each brand also has its own CorralData account built from the same clinic template, with a Manager Summary, a Provider Summary, rebooking trends, product sales and consumables inventory. Brands that manage on cash and brands that manage on accrual see both figures side by side, so neither has to change how it runs.
Average ticket is tracked separately for injectors, functional health providers and estheticians. That way an injector is compared with injectors at other brands instead of with an esthetician down the hall. Utilization is booked hours over billable hours, and rebooking measures whether a guest books a follow-up within 1, 14 or 18 days of a visit, with the same windows at every brand. The Injectables Mix Data App shows each provider's filler and biostimulator volume relative to neurotoxin.
Functional Health has its own KPI board and live tracker. A mapping sheet defines which services count as a consult or a functional health visit, so the membership-led line isn't forced into an injectables model. A service-to-product lookup that Annie maintains in Google Sheets powers cost of goods by treatment and by provider. The same lookup feeds inventory on hand, purchasing and month-end close, and payroll and commission reporting draw on the same sales data every provider's revenue is measured on.
In 2026 the marketing team brought its lead and campaign data into the same warehouse, with Aesthetix CRM, Google Ads, Meta Ads and Google Analytics 4 alongside Zenoti. Brands across the group now work from the same set of marketing Data Apps. Marketing KPIs tracks leads and lead quality by clinic, and the New Lead Funnel follows each lead through to a booked appointment and a new client. Speed to Lead measures response times against each clinic's business hours. Quarterly lead targets sit next to the actuals, so a brand leader can see distance to goal well before the quarter ends. Paid media reporting is being built on the same lead model.
The questions leadership asks every week are built into Data Apps, so a brand leader can check cross-brand KPIs or rebooking trends without waiting on a report. Annie runs dozens of them, including Cross-Brand KPIs, Rebooking Rate Trends and a Phone Skills Analysis app that scores front-desk calls.
Annie's in-house analyst works in the same governed layer every day. He uses Claude through CorralData MCP to answer ad hoc questions, trace a number back to its source and add new metrics to the Executive Summary. He also reviews the Data Dictionary with the CorralData team and flags definitions that have drifted, so every brand stays on the same version of each metric. Because Claude reads from the governed data model, its answers match what leadership sees in the Executive Summary. Leaders who prefer to stay in CorralData can ask AskCorral, CorralData's AI agent, which works from the same definitions.
Results
Annie now operates as one portfolio instead of a set of brands that each measure themselves differently. The warehouse holds sales history for 21 Zenoti centers across nine states, refreshed daily and monitored on a data status board. The analytics team answers most new questions itself, in Claude or a Data App.
The framework has handled acquisitions the way it was designed to. Since October 2025, three brands and eight locations have joined, taking the portfolio from 14 to 22 locations. Each was connected as its own Zenoti schema and given an account from the standard clinic template. Each was also added to the cross-brand Executive Summary, so it reports on the group's definitions alongside every other brand.
The metrics leadership governs on are the ones it set out to compare: revenue against budget by brand, provider utilization and rebooking against benchmark, average ticket by provider type, and new patients and leads against goal. When a provider or practice manager questions one, the definition behind it is written down and the same at every brand. When the next deal closes, the reporting is already in place.
CorralData connects EMR and POS systems, CRM and lead-tracking tools, ad platforms, accounting systems, payroll and HR systems, and inventory platforms, more than 600 data sources in total. Everything flows into one HIPAA-compliant data warehouse that refreshes automatically.
CorralData connects the new practice's existing EMR, point of sale, CRM, and other systems into the same governed data model, including practices that run a different EMR from the rest of the group. Its data maps to the group's established metric definitions and standard reporting templates, so it joins consolidated reporting without a rebuild.
There is no fixed list. If the data exists in a location's EMR, POS, or accounting system, CorralData can track it, trend it, and help a team optimize for it. Common examples include revenue against budget by brand, provider utilization and rebooking rate against benchmark, average ticket by provider type, new patients against goal, and cost of goods by treatment and provider. Any metric tied to a connected data source can be added.
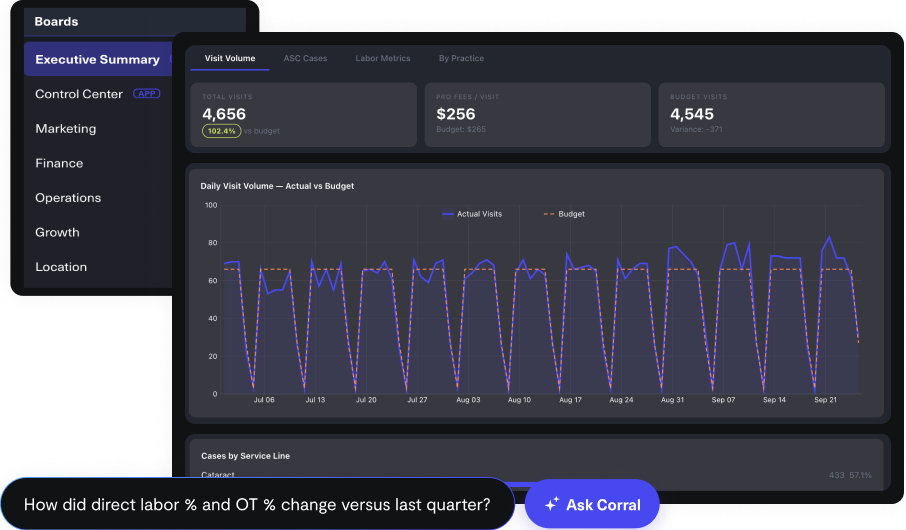
AskCorral is CorralData's AI agent. Teams can ask business questions in plain English and AskCorral answers and provides recommendations based on their connected data. For example, someone might ask how rebooking rates compare across brands for providers of the same type, and AskCorral can flag which locations need attention. Conversations with AskCorral reveal where a team needs to intervene, opportunities to capture, and actions to take. Beyond answering questions, AskCorral can build and modify dashboards and widgets, so teams never have to wait for someone to build new reports. Teams that work in Claude can reach the same data and definitions through CorralData MCP.
CorralData works with each customer to establish shared definitions for its core metrics, instead of recalculating them differently for every location or report. Those definitions live in a governed Data Dictionary backed by verified datasets, so a number reviewed locally matches what's reviewed at the corporate level. When a new brand joins, its data maps to those existing definitions rather than introducing a new version of every metric. Brands that manage on cash and brands that manage on accrual can see both figures side by side.
Keep reading
Case study
Case study
Case study
Make your data work for you. Book a demo today to see CorralData in action.
" alt="">