




 " alt="">
















Aesthetics & Wellness BenchmarkQ3 2026 · Jul 1 – Sep 30In partnership with
The State of Aesthetics: Q3 2026
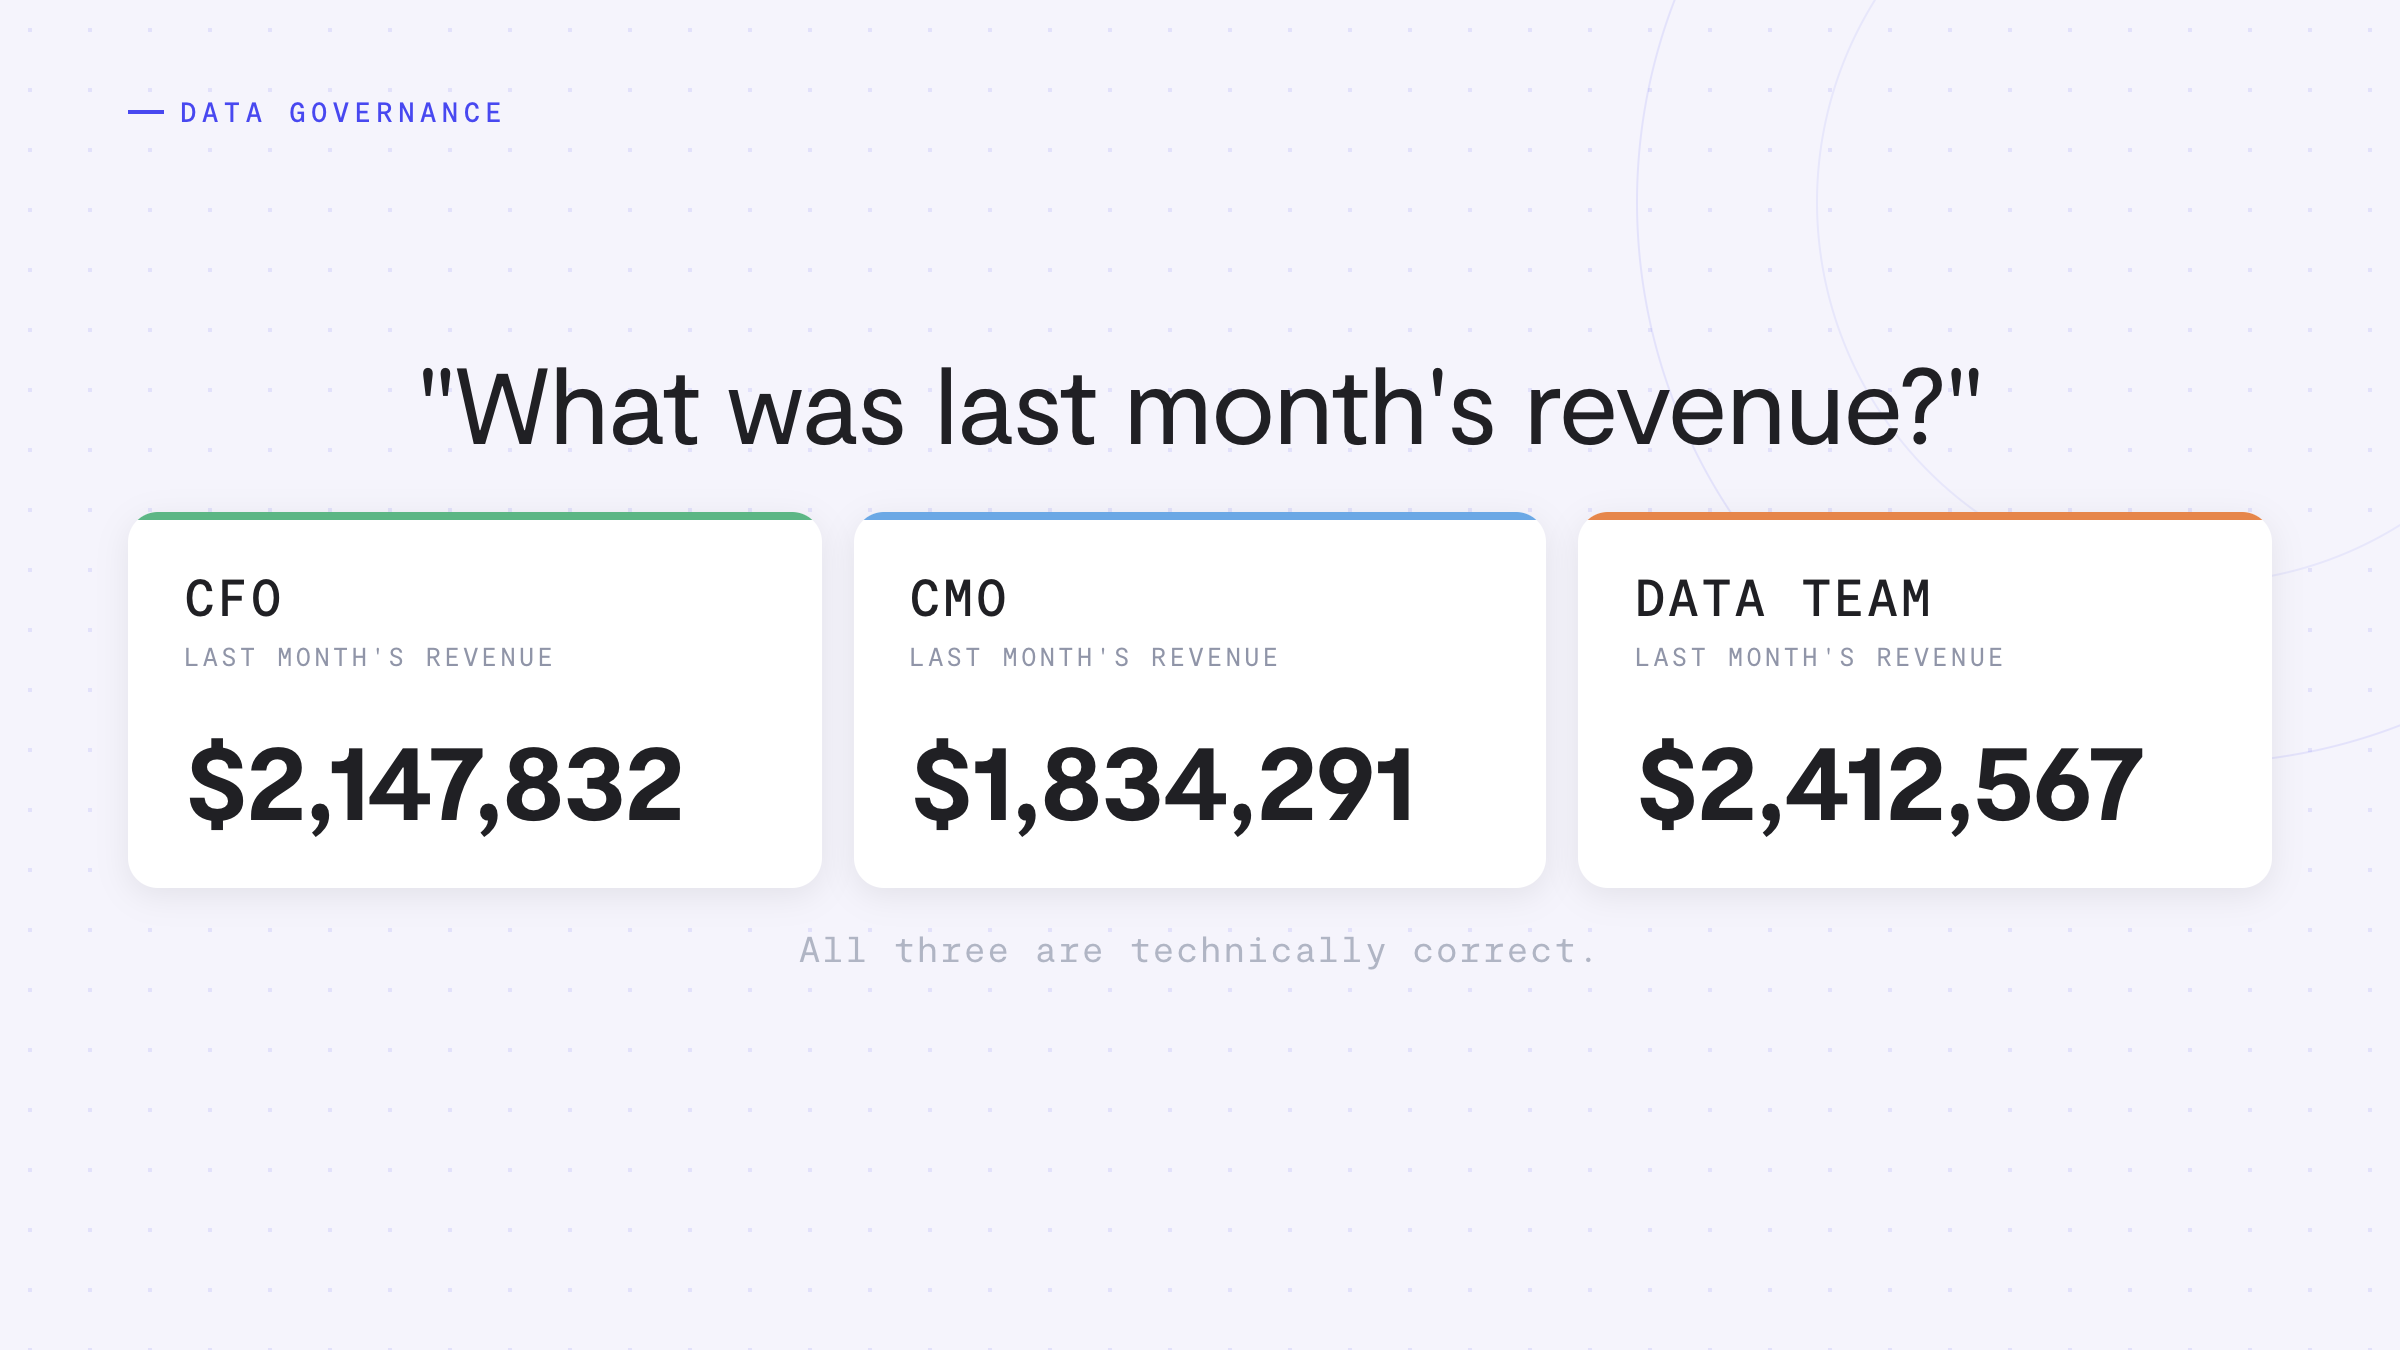
How the typical aesthetics and wellness operator performed from July through September 2026, measured from the systems operators run every day, not from a survey.
- Brands
- 150+
- Locations
- 500+
- Q3 2026 revenue
- $250M+
- Benchmarked measures
- 29
Reading this against H1 2026. Q3 covers three months and H1 covered six, so dollar totals and counts aren't comparable. The panel has also changed since H1, so the medians describe a typical operator, not the same group of businesses.
Unlock the full Q3 2026 report
The full report covers what drove growth, retention, membership, wellness and marketing across 500+ locations, plus all 29 measures broken out by operator size and operating model. Add your details and it opens right here.
Inside the report
- Executive summaryThe quarter's headline findings, and what to take into your next leadership meeting
- 01. GrowthWhere growth came from: newer locations, existing patients or new patients
- 02. New and existing patientsHow new patients' spend and service mix differ from existing patients'
- 03. RetentionRebooking, churn, lifetime value and how concentrated revenue is
- 04. MembershipHow often members come back, and what separates operators on enrollment
- 05. Service mixWhat carries revenue, and how operating model sets the ticket
- 06. WellnessWhich wellness lines are growing, and who is buying them
- 07. MarketingWhat ad-driven patients return, and what a new patient costs
- 08. ProductivityWhat a booked hour earns, and how full provider calendars are
- 09. No-shows and discountsWhere revenue leaks, and why discounts matter more than no-shows
- 10. Forward viewHow the forward book compares with last year, by operating model
- 11. Agentic analyticsWhat operators are asking their data, and how that is changing
- 12. OutperformersWhat top performers do, and the trade-offs they make
- 13. FAQShort answers to the questions operators and investors ask
- Appendix A: BenchmarksQ3 2026 benchmarks
- Appendix B: SizeQ3 2026 benchmarks by operator size, medians
- Appendix C: Operating modelsQ3 2026 benchmarks by operating model, medians
- Appendix D: MethodologyHow these numbers are built
Executive summary
Ten findings that define the quarter
Q3 2026 was a growth quarter. Revenue rose at the typical operator while new-patient counts held roughly flat, so growth came from patients already in the book and from newer locations. Here's what to take into your next board or leadership meeting.
+17.4%
Median revenue growth vs Q3 2025.
+7.0%
Same-store growth vs Q3 2025, locations open at least two years only.
82%
Share of revenue from existing patients. New patients brought in 17.7%.
+3.2%
Forward book in early October vs the same date last year.
- Revenue grew 17.4% at the median operator, and every size group grew. At locations open at least two years, same-store growth was 7.0%, so newer locations account for much of the difference.
- Existing patients are most of the revenue. They bring in about 82% of revenue. Their revenue grew 8.4% while revenue from new patients fell 6.9%, so a point of growth from existing patients moves your total about five times as much as a point from new ones.
- Rebooking is the retention number to watch. 71.0% of completed appointments led to another booking within 90 days, and lifetime value is $1,628 per patient. The top 10% of patients bring in 35.5% of revenue, so that's where a missed rebooking costs the most.
- Members come back far more often. Enrollment is the gap. 90.4% of members came back this quarter against 50.6% of non-members. Members stay loyal almost everywhere, but enrollment runs from 14.3% to 40.7% of active patients. Below the 26.6% median, fix the sign-up moment first.
- Average ticket size depends on operating model. It's $498 for pure aesthetics, $366 for wellness-integrated and $276 for wellness-ledOperating models are set by each operator's wellness share of revenue. Pure aesthetics: under 5%. Wellness-integrated: 5% to 30%. Wellness-led: over 30%. Full definitions are in Appendix D., against $396 overall. Compare yours with operators who run your model.
- Wellness held steady. It was 9.0% of revenue, level with a year ago and roughly double its early-2024 share. Cross-sell runs one way. Among operators that offer both lines, 34.1% of wellness patients bought aesthetics, but only 6.2% of aesthetics patients bought wellness. Your aesthetics base is the untapped group.
- Ad spend looks efficient, but acquisition cost varies widely. Median LTV:CAC is about 16 to 1. Blended acquisition cost is $95 per new patient, from $44 or less to $280 or more across the middle half, depending partly on what an operator sells. Lifetime value is revenue, not profit.
- Revenue per service hour and provider utilization are separate levers. A booked hour earns $591 at the median operator, and appointments fill 29.8% of scheduled provider hours. The two are unrelated in this data: a busy calendar doesn't fix a low rate, and a high rate doesn't fill empty hours. Check both.
- AI use is spreading across teams, with 2.5× usage growth over last quarter. Teams are asking most about revenue trends, services, and scheduling to grow the practice.
- The forward book splits by operating model. The median operator is 3.2% ahead of last year. Wellness-integrated operators are 10.8% ahead and wellness-led operators 3.8%, but pure aesthetics is about flat at +0.7%. Check yours now, while there's time to fill Q4.
01Growth
Growth came from existing patients and newer locations
The median operator grew revenue 17.4%. Same-store growth, at locations with at least two years of history, was 7.0%. Newer locations account for much of the difference. Operator by operator, existing patients added about 5 points of growth for the typical operator and newer locations about 4. These are medians across different operators, so they don't add up to 17.4% or close the gap to 7.0%.
+17.4% (better)
Total revenue growth
vs Q3 2025, all locations included.
+7.0% (better)
Same-store growth
vs Q3 2025, locations open at least two years only.
+8.4% (better)
Existing-patient revenue growth
vs Q3 2025, locations open in both years, a wider set than same-store.
$171,742 (better)
Revenue per location per month
+22.9% vs Q3 2025.
Existing patients drove much of the growth. On locations open in both Q3 2025 and Q3 2026 (a wider set than same-store, so the two rates don't reconcile), revenue from existing patients grew 8.4% at the median operator, while revenue from new patients fell 6.9% and new-patient counts slipped 1.8%. Existing patients bring in about 82% of revenue, so a point of growth there moves the total about five times as much as a point from new patients.
Newer locations also hide weakness at the bottom of the panel. About one in five operators did not grow at all. A quarter grew total revenue 1.8% or less, and a quarter saw same-store revenue fall 6.2% or more. Without newer locations, the bottom of the panel would look like a decline, not a slowdown.
Operators of every size grew: +15.2% for 1 to 5 locations, +17.1% for 6 to 20 and +18.2% for 21 or more. Same-store growth was +2.8% for 6 to 20 locations and +2.3% for 21 or more, against +7.3% for 1 to 5, and mid-size operators' new-patient counts fell 17.4% (Exhibit 2).
By operating model, wellness-integrated operators grew faster in total (+21.2% against +17.1% for pure aesthetics) but more slowly same-store (+5.1% against +7.3%). New patients set them apart: new-patient counts grew 7.4% at wellness-integrated operators and fell 7.6% at pure aesthetics operators (Exhibit 3).
Skytale commentary
Getting found is harder now, between a changing search landscape and more competition. More patients ask ChatGPT or rely on Google's AI Overviews to choose a practice instead of scrolling through search results, so practices have to rethink how they show up. Holding new-patient counts nearly flat is often a win, but it isn't a reason to lean on existing patients alone. Marketing works as a system: lead generation brings people in, automated follow-up keeps leads from going cold before they book, and loyal patients are the best place to test new offers before spending on ads. Keeping a patient almost always costs less than winning a new one, so retention and reactivation matter more every quarter.
What to do about it
Split your own growth three ways: newer locations, existing patients and new patients. If your same-store growth is below the 7.0% median, your established locations are growing slower than most, and new capacity may be masking it. Existing-patient revenue growing slower than about 8% puts you behind where most of the revenue is. Holding new-patient revenue flat already puts you near the top quarter.
Show all data · Exhibits 1 to 3
Percentile tables (p25, median, p75)
- Each row shows how operators are spread on one measure.
- Median is the typical operator: half sit above it and half below.
- p25 to p75 is where the middle half of operators fall.
- Each column is ranked on its own, so the values in one column come from different operators and don't add up to 100%.
Tables by operator size
- Each column is the median operator in that size group. Size is the operator's number of locations.
- Each column is ranked on its own, so the values across a row come from different operators.
- Size groups are small, so read the gaps between them as direction, not precision.
Tables by operating model
- Each column is the median operator for one operating model, set by wellness share of revenue: pure aesthetics under 5%, wellness-integrated 40% to 5%, wellness-led over 30%.
- Each column is ranked on its own, so the values across a row come from different operators.
- Methodology has the full definitions.
Withheld means too few operators to publish safely.
| Metric | p25 | Median | p75 |
|---|---|---|---|
| Total revenue growth, year over year | +1.8% | +17.4% | +21.9% |
| Same-store revenue growth, year over year | −6.2% | +7.0% | +19.6% |
| Existing-patient revenue growth, year over year | −2.7% | +8.4% | +23.5% |
| New-patient revenue growth, year over year | −21.4% | −6.9% | +0.7% |
| Revenue per location per month | $140,042 | $171,742 | $220,582 |
| New-patient count growth, year over year | −18.6% | −1.8% | +11.3% |
Operator-level medians. Total growth includes newer locations; same-store growth does not. Newer locations are any location outside the same-store set: opened within about the last two years, still ramping, or with data that starts later. The data can't separate these. New-patient count growth is the change in the number of patients whose first-ever purchase fell in the quarter. Existing-patient and new-patient revenue growth use locations open in both quarters. A patient counts as new or existing separately in each quarter, by first-ever activity.
| Metric | 1-5 locations | 6-20 locations | 21+ locations |
|---|---|---|---|
| Total revenue growth, year over year | +15.2% | +17.1% | +18.2% |
| Same-store revenue growth, year over year | +7.3% | +2.8% | +2.3% |
| New-patient count growth, year over year | −1.2% | −17.4% | +2.5% |
Median operator in each group. Size is the operator's number of locations. Groups are small, so read the gaps as direction, not precision. Every size cut is in Appendix B.
| Metric | Pure aesthetics (<5% wellness) | Wellness-integrated (5-30%) | Wellness-led (>30%) |
|---|---|---|---|
| Total revenue growth, year over year | +17.1% | +21.2% | Withheld: too few operators to publish safely |
| Same-store revenue growth, year over year | +7.3% | +5.1% | Withheld: too few operators to publish safely |
| New-patient count growth, year over year | −7.6% | +7.4% | Withheld: too few operators to publish safely |
Median operator in each group. Pure aesthetics: under 5% of revenue from wellness. Wellness-integrated: 5-30%. Wellness-led: over 30%. Withheld where the group is too small to publish safely, or where showing it would reveal another group by subtraction.
02New and existing patients
New patients are a smaller share of revenue, and they spend less
New patients brought in 17.7% of revenue at the median operator, down 2.7 points from a year ago. They arrive with a smaller ticket and a different mix: more laser, fewer injectables and much less wellness. That shapes what to offer them first.
17.7% (worse)
Revenue from new patients
−2.7 pts vs Q3 2025 (20.4%).
−1.8% (worse)
New-patient count growth
vs Q3 2025, at the median operator.
$384
New-patient ticket
About 9% below existing patients.
$422
Existing-patient ticket
All of a patient's invoices in the quarter.
In the bottom quarter of operators, new-patient counts dropped 19% or more. In the top quarter, they grew 11% or more.
New patients buy differently. Laser and energy is 13.3% of their revenue against 8.3% for existing patients, injectables are 39.9% against 43.4%, and wellness is 3.7% against 10.6%. Wellness is mostly something patients add once they're already coming in, which matches section 06.
What to do about it
Plan for new and existing patients separately. Get existing patients to book again first, because that's where the revenue is. Test acquisition offers against your service mix. If you discount to win new patients, check that they rebook within 90 days.
Show all data · Exhibits 4 and 5
Percentile tables (p25, median, p75)
- Each row shows how operators are spread on one measure.
- Median is the typical operator: half sit above it and half below.
- p25 to p75 is where the middle half of operators fall.
- Each column is ranked on its own, so the values in one column come from different operators and don't add up to 100%.
Other tables
- Each value is the median operator for that row and column, unless the column says otherwise.
- Each column is ranked on its own, so values in different columns can come from different operators.
Withheld means too few operators to publish safely.
| Metric | p25 | Median | p75 |
|---|---|---|---|
| Revenue from new patients | 14.0% | 17.7% | 20.6% |
| New-patient count growth, year over year | −18.6% | −1.8% | +11.3% |
Revenue from new patients is the share of revenue from patients whose first-ever paid purchase fell in the quarter. Two effects move the year-over-year change in this share in opposite directions. Connected history is shallower for Q3 2025, so some returning patients look new then, which overstates the fall. Locations and brands connected after Q3 2025 count every patient as new in Q3 2026, which understates it. Both are disclosed, not corrected.
| Measure | New patients | Existing patients |
|---|---|---|
| Average ticket | $384 ($278 to $456) | $422 ($293 to $536) |
| Injectables, share of revenue | 39.9% | 43.4% |
| Laser and energy, share of revenue | 13.3% | 8.3% |
| Skin and facials, share of revenue | 7.2% | 7.0% |
| Wellness, share of revenue | 3.7% | 10.6% |
Median across operators, with the middle half in brackets for ticket. A new patient is one whose first-ever purchase fell in the quarter, and ticket counts all of that patient's invoices in the quarter. This is not comparable with the $396 median ticket in section 05, which covers every visit invoice.
03Retention
Rebooking is the retention number to watch, and the top 10% of patients carry a third of revenue
At the median operator, 71.0% of completed appointments led to another booking within 90 days, churn improved 2.4 points and patient lifetime value is $1,628. The risk is concentration: the top 10% of patients bring in 35.5% of revenue.
71.0%
Rebooked within 90 days
Share of completed appointments followed by another booking.
44.6% (better)
Patient churn
−2.4 pts vs Q3 2025. Lower is better.
$1,628
Patient lifetime value
All-time revenue per patient.
35.5%
Revenue from the top 10%
Of patients, by spend.
A quarter of operators rebook 76.5% or more of completed appointments, and a quarter rebook 61.5% or less. The weak end sits further from the median (9.5 points below it) than the strong end does (5.5 points above), so there's more room to fall behind than to pull ahead.
For churn, lower is better. It was 44.6% at the median operator, with a quarter of operators at 40.3% or less and a quarter at 50.3% or more. First-time patients are the group to watch: of patients who first visited in Q2 2026, 45.2% came back within 60 days.
Lifetime value has a long upside. The top quarter of operators reach $2,578 or more per patient, 58% above the median, while the bottom quarter sit at $1,321 or less, 19% below.
Within the existing base, revenue concentrates in the high-value tier. Existing patients are split into thirds by what they spent on services and products in the 12 months before the quarter, set within each brand: high value is the top third, mid value the middle third and low value the bottom third. Existing patients who spent nothing in that window are a separate group. The high-value tier brings in 50.1% of revenue at the median operator, and those patients visit more often (1.79 times in the quarter, against 1.5 to 1.6 for the other tiers).
Tiers are thirds of existing patients by service and product spend in the prior 12 months, set within each brand, plus existing patients with no spend in that window. Median across operators for each tier, so the shares don't add to 100%. The tiers divide revenue on their own basis, so the new-patient share here (16.5%) differs from the 17.7% in section 02, which is the headline figure.
Operating model pulls retention and value apart. Wellness-led operators see each patient 2.40 times a quarter against 1.54 for pure aesthetics, and lose fewer patients (28.5% churn against 49.3%). But they do no better at bringing patients back a year later (39.2% against 39.8%), and their lifetime value is the lowest ($1,449 against $1,993). Recurring wellness visits keep patients active within the quarter, and so far that hasn't turned into more value per patient. The wellness-led group is small, so read this as a pattern, not a precise figure.
What to do about it
Know who your top 10% are, and make sure each of them leaves with the next appointment booked. If you run wellness, compare lifetime value for wellness and aesthetics patients to see whether more frequent visits turn into more spend.
Show all data · Exhibits 6 to 8
Percentile tables (p25, median, p75)
- Each row shows how operators are spread on one measure.
- Median is the typical operator: half sit above it and half below.
- p25 to p75 is where the middle half of operators fall.
- Each column is ranked on its own, so the values in one column come from different operators and don't add up to 100%.
Tables by operating model
- Each column is the median operator for one operating model, set by wellness share of revenue: pure aesthetics under 5%, wellness-integrated 40% to 5%, wellness-led over 30%.
- Each column is ranked on its own, so the values across a row come from different operators.
- Methodology has the full definitions.
Other tables
- Each value is the median operator for that row and column, unless the column says otherwise.
- Each column is ranked on its own, so values in different columns can come from different operators.
Withheld means too few operators to publish safely.
| Metric | p25 | Median | p75 |
|---|---|---|---|
| Rebooked within 90 days | 61.5% | 71.0% | 76.5% |
| New patients back within 60 days (Q2 2026 new patients) | 41.3% | 45.2% | 51.6% |
| Patients returning from a year ago | 34.8% | 42.2% | 47.4% |
| Patient churn (lower is better) | 40.3% | 44.6% | 50.3% |
| Visits per patient | 1.50 | 1.62 | 1.83 |
| Days between visits | 22 days | 24 days | 25 days |
| Patients who visited once | 57.2% | 61.0% | 67.7% |
| Revenue from the top 10% of patients | 31.2% | 35.5% | 39.7% |
| Patient lifetime value | $1,321 | $1,628 | $2,578 |
Churn compares Q3 against Q2. 60-day return uses patients whose first-ever visit was in Q2 2026, so every one of them has had a full 60 days. Visits, gaps and single-visit share are measured inside one quarter. Top 10% of patients is ranked within each location and then pooled, not within each operator.
| Metric | Pure aesthetics (<5% wellness) | Wellness-integrated (5-30%) | Wellness-led (>30%) |
|---|---|---|---|
| Rebooked within 90 days | 66.4% | 74.5% | 82.6% |
| New patients back within 60 days (Q2 2026 new patients) | 45.1% | 43.8% | 61.9% |
| Patients returning from a year ago | 39.8% | 42.5% | 39.2% |
| Patient churn (lower is better) | 49.3% | 43.9% | 28.5% |
| Visits per patient | 1.54 | 1.71 | 2.40 |
| Days between visits | 24 days | 23 days | 25 days |
| Patients who visited once | 65.5% | 59.8% | 38.3% |
| Revenue from the top 10% of patients | 35.6% | 37.8% | 30.0% |
| Patient lifetime value | $1,993 | $1,712 | $1,449 |
Median operator in each group.
| Patient group | Share of revenue | Visits per patient |
|---|---|---|
| New patients | 16.5% | 1.60 |
| Existing, low value | 7.5% | 1.54 |
| Existing, mid value | 18.7% | 1.50 |
| Existing, high value | 50.1% | 1.79 |
| Existing, no spend in prior 12 months | 5.5% | 1.49 |
Median across operators for each group, so the shares don't add to 100%. Tiers split existing patients in three by service and product spend in the 12 months before the quarter. Patients with no spend in that window are shown separately. Tiers are set within each brand, not across a whole operator.
04Membership
Members come back far more often, and enrollment is what separates operators
Members come back far more often than non-members. 90.4% of members came back this quarter against 50.6% of non-members, and what separates operators is how many patients join, not how loyal members are.
26.6% (better)
Membership penetration
Of active patients. +3.8 pts vs Q3 2025.
90.4%
Member retention
Against 50.6% for non-members, about 40 points apart.
1.70×
Member vs non-member spend
In the quarter.
Member retention is high almost everywhere: a quarter of operators keep 76.2% of members or fewer, and a quarter keep 94.5% or more. Membership penetration varies far more, from 14.3% at the weak end to 40.7% at the strong end. Membership dues made up 4.7% of revenue at the median operator.
Members spend about 1.7 times what non-members spend in the quarter at the median location. Part of both gaps is who chooses to join, so treat them as an upper bound on what membership does on its own.
What to do about it
The lever is enrollment, not perks: three quarters of operators keep 76% or more of their members. If you're below the 26.6% median, fix the in-clinic sign-up moment before you change the offer, and price membership against how often members visit.
Show all data · Exhibit 9
- Each row shows how operators are spread on one measure.
- Median is the typical operator: half sit above it and half below.
- p25 to p75 is where the middle half of operators fall.
- Each column is ranked on its own, so the values in one column come from different operators and don't add up to 100%.
- Withheld means too few operators to publish safely.
| Metric | p25 | Median | p75 |
|---|---|---|---|
| Membership penetration | 14.3% | 26.6% | 40.7% |
| Member retention | 76.2% | 90.4% | 94.5% |
| Non-member retention | 40.4% | 50.6% | 56.9% |
| Member vs non-member spend | 1.29× | 1.70× | 2.20× |
Member retention counts memberships, not patients. Member vs non-member spend is a median across locations, not operators (see Appendix D).
05Service mix and ticket
Injectables carry the business, and operating model sets the ticket
Injectables are 44.0% of revenue at the median operator, the largest category by far. Ticket depends on operating model, and the patients most likely to raise it are already on the books.
Categories come from each operator's own service catalog, mapped to one taxonomy. Wellness (all lines) includes GLP-1 and weight loss, hormones and peptides, IV and vitamins, labs, sexual health and regenerative services, a wider set than the wellness share in section 06. Each category is a separate median, so the shares don't add to 100%.
$396
Median ticket
All operators.
$498
Pure aesthetics
Under 5% of revenue from wellness.
$366
Wellness-integrated
5% to 30% of revenue from wellness.
$276
Wellness-led
Over 30% of revenue from wellness.
Operating models are set by each operator's wellness share of revenue, as defined in section 06. Average ticket is net service and product revenue per visit invoice. Standalone membership and gift-card invoices are left out.
A strong ticket is $529 or more and a weak one $315 or less, but where you land depends on your model. The wellness-led ticket is likely lower because those operators see patients more often for smaller visits, such as weekly GLP-1 injections and lab draws. It's the average across all of their visits, not the price of a wellness service, and they still earn about the same per booked hour as wellness-integrated operators ($491 against $486).
The room to grow ticket sits with patients who already come in. At the median operator, about a third of wellness patients also buy aesthetics, and pure aesthetics runs the highest ticket of the three models. Section 06 covers where that cross-sell happens and where it doesn't.
What to do about it
Judge your ticket against your own model: $366 is typical for wellness-integrated and weak for pure aesthetics. If injectables are well above 44.0% of your revenue, a change in injectable pricing or demand hits you harder than most.
06Wellness deep dive
Wellness held steady at 9% of revenue, roughly double its 2024 share
Wellness was 9.0% of revenue at the median operator, level with a year ago and roughly double its early-2024 share. It grew between 2024 and 2025 and has held around 9% this year. Existing patients do most of the buying, and the cross-sell runs mostly one way.
9.0%
Wellness share of revenue
Level with 9.1% in Q3 2025.
9.7%
GLP-1 patients new to the practice
Of patients who bought GLP-1 in Q3.
34.5%
Wellness patients who buy aesthetics
In the same quarter.
4.7%
Aesthetics patients who buy wellness
The bigger untapped group.
Wellness share means weight loss and GLP-1, hormones and peptides, and IV and vitamin services as a share of total revenue. It sets each operator's operating model: pure aesthetics under 5%, wellness-integrated 5% to 30%, wellness-led over 30%.
The median wellness share rose from 4.1% in Q1 2024 to 9.1% in Q3 2025, and was 9.0% in Q3 2026. Early quarters cover fewer operators.
Which lines
GLP-1 and weight loss is the largest line: 4.1% of total revenue at the median operator, ahead of hormones and peptides (1.3%) and IV and vitamins (0.3%). The mix shifts with operating model, and GLP-1 reaches 16.3% of revenue at wellness-led operators (Exhibit 10). Within wellness, the more wellness-heavy the operator, the more it's a GLP-1 business: GLP-1 is 47% of wellness revenue at the median pure aesthetics operatorOperating models are set by each operator's wellness share of revenue. Pure aesthetics: under 5%. Wellness-integrated: 5% to 30%. Wellness-led: over 30%. Full definitions are in Appendix D., 64% at wellness-integrated and 75% at wellness-led. For pure aesthetics operators, where wellness is under 5% of revenue, that's a share of a small line.
These shares are of wellness revenue only (GLP-1 and weight loss, hormones and peptides, IV and vitamins), not total revenue. Pure aesthetics operators get under 5% of their revenue from wellness (0.9% at the median), so GLP-1 is a small dollar line for them even when it's nearly half of their wellness.
Skytale commentary
GLP-1 volume is holding up, but the economics are shifting underneath operators. Manufacturer cash-pay programs and new oral options have pulled branded cash pricing down to a few hundred dollars a month, and with compounding restricted, more patients are landing on branded products. The price patients expect is lower than a year ago, which could compress revenue per patient even where volume grows. To tell a durable line from a bump, watch four things: how many patients are still on program at 6 and 12 months (not just starts), the share of wellness patients who also buy aesthetics, how much revenue is recurring (membership or monthly program) versus one-time, and margin per patient after drug cost. A line that holds up as drug prices fall is durable. One that depends on a pricing gap is more likely a bump.
Who buys it
GLP-1 is mostly a cross-sell to existing patients. Among patients who bought GLP-1 in Q3, only 9.7% were new to the practice at the median operator. The rest were existing patients adding it to what they already buy.
Cross-sell runs mostly one way. 34.5% of wellness patients also bought an aesthetics service in Q3, but only 4.7% of aesthetics patients also bought wellness. Operators differ far more on the aesthetics side, where the middle half runs from 1.6% to 8.8%, more than fivefold, against 25.7% to 49.8% the other way. Part of the gap is structural, since some wellness-heavy operators sell few aesthetics services, but limiting the comparison to operators that offer both lines doesn't change the pattern. Where each line is at least 1% of patients and at least 20 patients, 34.1% of wellness patients bought aesthetics and 6.2% of aesthetics patients bought wellness (Exhibit 12).
Wellness is also a front door, though a small one. At the median operator, 3.2% of new patients first came in through a wellness visit, against 3.5% a year ago. That rises to 6.9% at wellness-integrated and 42.5% at wellness-led operators. Few of them cross over early: of patients who started with wellness in Q2 2026, 7.7% bought an aesthetics service within 90 days, against 34.5% of all wellness patients who bought aesthetics in the quarter. The cross-sell in Exhibit 11 builds over a longer relationship.
What it does to the business
Wellness trades ticket size for frequency. Wellness-led operators run a $276 ticket against $498 for pure aesthetics, see each patient more often and lose fewer patients (section 03). Operators with more wellness revenue lose fewer patients, and the relationship holds when we remove the most influential operators or look at aesthetics operators only.
Read that as a feature of the business model, not a lever. Wellness programs are built on recurring visits, which lowers measured churn by design. It doesn't show that adding wellness to a practice lowers churn.
Skytale commentary
The lower churn at wellness-led operators comes mostly from the recurring-visit model. Wellness programs (GLP-1, hormones, IV, peptides) are built around monthly or quarterly touchpoints, so a patient in the middle of a program is less likely to lapse in a rolling churn window. The longer-relationship effect is plausible but secondary: more touchpoints give providers more chances to introduce aesthetics services, which is where the cross-sell upside sits. Tracking wellness and aesthetics churn separately is the right test. This is all new enough that there isn't yet the data to prove at scale that wellness builds longer patient relationships.
What to do about it
Sell wellness to the patients you already have before paying to acquire new ones. Your aesthetics base is the bigger untapped group, so test a wellness consult offer at checkout. For patients who start on wellness, plan the aesthetics introduction for later visits, not the first 90 days. Track churn and lifetime value separately for wellness and aesthetics patients.
Show all data · Exhibits 10 to 12
Percentile tables (p25, median, p75)
- Each row shows how operators are spread on one measure.
- Median is the typical operator: half sit above it and half below.
- p25 to p75 is where the middle half of operators fall.
- Each column is ranked on its own, so the values in one column come from different operators and don't add up to 100%.
Tables by operating model
- Each column is the median operator for one operating model, set by wellness share of revenue: pure aesthetics under 5%, wellness-integrated 40% to 5%, wellness-led over 30%.
- Each column is ranked on its own, so the values across a row come from different operators.
- Methodology has the full definitions.
Other tables
- Each value is the median operator for that row and column, unless the column says otherwise.
- Each column is ranked on its own, so values in different columns can come from different operators.
Withheld means too few operators to publish safely.
| Wellness line | All operators | Wellness-integrated | Wellness-led |
|---|---|---|---|
| GLP-1 and weight loss | 4.1% | 7.4% | 16.3% |
| Hormones and peptides | 1.3% | 3.2% | 10.7% |
| IV and vitamins | 0.3% | 0.6% | 0.9% |
Shares of each operator's total revenue, then the median across operators. The three medians don't add up to the 9.0% wellness share, because each median comes from a different operator.
| Metric | p25 | Median | p75 |
|---|---|---|---|
| Wellness patients who also buy aesthetics | 25.7% | 34.5% | 49.8% |
| Aesthetics patients who also buy wellness | 1.6% | 4.7% | 8.8% |
Each patient counted once per operator.
| Operators included | Wellness patients who also buy aesthetics | Aesthetics patients who also buy wellness |
|---|---|---|
| All operators | 34.5% (25.7% to 49.8%) | 4.7% (1.6% to 8.8%) |
| At least 20 patients and 1% on each side | 34.1% (26.7% to 48.5%) | 6.2% (3.9% to 10.1%) |
| At least 50 patients and 2% on each side | 30.7% (25.8% to 44.1%) | 6.7% (4.7% to 10.3%) |
Median across operators, with the middle half in brackets. Percentages are of each operator's own wellness or aesthetics patients, pooled across its locations. Wellness-only operators contribute 0% to the first column in the all-operator row and drop out of the filtered rows.
07Marketing efficiency
Median LTV:CAC is about 16 to 1
Among operators with ad platforms connected, the median LTV:CAC was about 16 to 1, down from about 21 to 1 a year ago. It values each patient won through ads at the typical patient's lifetime spend, so it estimates payback rather than measuring it. The spread is wide. Lifetime value is revenue, not profit, so check it against your margins before you raise spend.
16.13×
LTV:CAC
Ad-attributed patients, at the median operator.
$95
Blended CAC
Google and Meta spend per new patient.
42.1%
Meta share of paid spend
Google takes the other 57.9%.
LTV:CAC runs from about 5× at the weak end to about 36× at the strong end, a sevenfold gap.
Blended acquisition cost counts Google and Meta spend against every new patient, not just the ones ad platforms claim. At the median it's $95. A quarter of operators pay $44 or less per new patient, and a quarter pay $280 or more.
Meta takes 42.1% of paid media spend at the median operator and Google 57.9%, though operators range widely, from 26% to 67% Meta across the middle half. We don't report a year-over-year change in the mix, because the comparison depends on which operators are included each year.
What to do about it
Acquisition cost depends on what an operator sells: a consult-led, high-ticket treatment plan costs more to win than an injectable visit, and the mix differs by operating model. Compare your CAC with operators who run a model like yours, not with the median alone.
Show all data · Exhibit 13
- Each row shows how operators are spread on one measure.
- Median is the typical operator: half sit above it and half below.
- p25 to p75 is where the middle half of operators fall.
- Each column is ranked on its own, so the values in one column come from different operators and don't add up to 100%.
- Withheld means too few operators to publish safely.
| Metric | p25 | Median | p75 |
|---|---|---|---|
| LTV:CAC (ad-attributed patients) | 4.84× | 16.13× | 35.73× |
| Blended CAC (lower is better) | $44 | $95 | $280 |
| Meta share of paid media spend | 26.3% | 42.1% | 67.3% |
| Google share of paid media spend | 32.7% | 57.9% | 73.7% |
LTV:CAC is the operator's average lifetime revenue per patient, multiplied by its new patients attributed to Google and Meta ads, divided by Google plus Meta spend. Blended CAC is Google plus Meta spend divided by all new patients, the same definition as H1. Both cover operators with ad platforms connected and current data. Meta share is Meta spend over Google plus Meta spend, and Google share is the rest.
08Productivity
A booked hour earns $591, but only about 30% of provider hours are filled
Two separate numbers decide how well a schedule performs: what each booked hour earns, and how many scheduled hours get booked at all. They're unrelated in this data, so an operator can be strong on one and weak on the other. Read them together.
$591
Revenue per service hour
Per booked hour, at the median.
29.8%
Provider utilization
Share of scheduled hours filled.
$83,782 (better)
Revenue per provider
In the quarter. +10.0% vs Q3 2025.
10.1% (worse)
Provider turnover
Lower is better. Up from 8.3% in Q3 2025.
Revenue per booked hour runs from $442 at the weak end to $682 at the strong end, so the 75th-percentile operator earns about 1.5 times the 25th. Utilization runs from about 18% to 39%. Pure aesthetics operators earn $608 per booked hour, against $486 for wellness-integrated and $491 for wellness-led.
Treat 29.8% as a floor on chair time. Scheduled hours include breaks and, in some systems, staff who aren't bookable providers. The median also covers all scheduled hours, so the gap between prime and off-peak hours is likely much wider than the headline suggests.
Utilization doesn't explain growth in this data, and turnover shows no reliable relationship with revenue per booked hour. With a panel this size, that doesn't rule out a moderate one. Across all operators the link between growth and revenue per booked hour is loose, but top performers earn more at the median ($599 against $527, section 12).
Skytale commentary
This metric is noisy because it's sensitive to definition. Scheduled hours include blocked time, admin time and shifts staffed for peak demand, so the number often looks lower than operators expect. Most operators would call a schedule full when prime hours (evenings, weekends, lunch) are booked solid with a few weeks of forward availability, not when every hour is filled. Skytale's general benchmark is that at 80% utilization of prime or bookable hours, an operator should consider hiring another provider. That threshold isn't comparable to the 29.8% median here, which is measured against all scheduled provider hours, including blocked, admin and other non-bookable time.
Low utilization · high revenue per hour
Fill the schedule. The hour is already well paid.
High utilization · high revenue per hour
Protect it. Capacity is the constraint.
Low utilization · low revenue per hour
Both. Start with mix and pricing.
High utilization · low revenue per hour
Raise what each hour earns: pricing, mix, add-ons, memberships.
Cut at each metric's median (29.8% and $591). Operators land in all four boxes, but two-thirds sit in the mixed ones: busy schedules earning less per hour, or high-earning hours with open time. So the advice depends on where an operator sits, not on the median.
What to do about it
Below $591 per booked hour, look at price, discounting and what fills your prime hours. Below 29.8% utilization, look at the schedule: open slots, rebooking at checkout and the forward book. If both are low, treat them as two problems and start with the one furthest from the median.
Show all data · Exhibit 14
- Each row shows how operators are spread on one measure.
- Median is the typical operator: half sit above it and half below.
- p25 to p75 is where the middle half of operators fall.
- Each column is ranked on its own, so the values in one column come from different operators and don't add up to 100%.
- Withheld means too few operators to publish safely.
| Metric | p25 | Median | p75 |
|---|---|---|---|
| Revenue per service hour | $442 | $591 | $682 |
| Revenue per provider | $54,964 | $83,782 | $113,865 |
| Provider utilization | 18.1% | 29.8% | 39.4% |
| Provider turnover (lower is better) | 6.1% | 10.1% | 13.1% |
Revenue per provider is for one quarter; H1 published a half-year figure. Providers who work at several locations count once. Revenue per service hour is per booked hour, so it reflects price and service mix, not how full the calendar is. It divides by raw appointment time, so it runs about 9% below revenue per utilized hour at the median. Utilization isn't measured the same way across systems: scheduled hours come from recorded shifts, calendars or availability templates. A few operators with unusable scheduled-hours figures are set aside in the quadrant, and the utilization median doesn't change.
09No-shows and discounts
Discounts take a much bigger share of revenue than no-shows, and fees are rarely charged
Missed appointments cost the median operator 2.1% of revenue. Discounts take 16.6% of gross revenue, a much bigger share than no-show losses. On no-shows, fees recover little, so prevention at booking matters more than the fee.
2.1%
Revenue lost to no-shows
Lower is better.
4.2%
Fee charges per missed appointment
No-shows plus cancellations.
16.6%
Discount rate
Of gross revenue. About flat vs Q3 2025.
85.0% (worse)
Appointment completion
−1.5 pts vs Q3 2025.
For no-shows, lower is better: the best quarter of operators lose 1.8% of revenue or less, and the weakest quarter lose 3.1% or more. Wellness-led operators run a higher no-show rate (2.8% against 1.4% for pure aesthetics). Fee charges equal 4.2% of missed appointments, down 0.5 points on operators present in both years, and even the top quarter of operators only reach about one in ten (10.3%).
Discounting is where the larger dollars go. The median operator gave up 16.6% of gross revenue to discounts, about flat on operators present in both years (up 0.2 points). The middle half runs from 11.3% to 24.2%, and the heavy end stretches further from the median (7.6 points above it against 5.3 below).
Operators that charge fees more often don't rebook more in this data. This compares operators with each other, so it doesn't test whether enforcing a fee changes patient behavior.
Skytale commentary
What tends to work is a card on file at booking for every patient, a deposit (flat or a percentage) on high-value or long appointments and for new patients, a clear 24 to 48 hour cancellation window with confirmed reminders, and a waitlist to backfill late cancellations. The more automated reminders, the better. What operators actually enforce is narrower. Most charge consistently only on high-value services and repeat offenders, because waiving fees for good patients is common, especially on a first offense. That gap between written policy and enforcement is likely what sits behind the 4.2% charge rate.
Show all data · Exhibit 15
- Each row shows how operators are spread on one measure.
- Median is the typical operator: half sit above it and half below.
- p25 to p75 is where the middle half of operators fall.
- Each column is ranked on its own, so the values in one column come from different operators and don't add up to 100%.
- Withheld means too few operators to publish safely.
| Metric | p25 | Median | p75 |
|---|---|---|---|
| No-show rate (lower is better) | 1.4% | 1.8% | 2.4% |
| Revenue lost to no-shows (lower is better) | 1.8% | 2.1% | 3.1% |
| Fee charges per missed appointment | 1.3% | 4.2% | 10.3% |
| Appointment completion | 84.0% | 85.0% | 89.0% |
| Discount rate | 11.3% | 16.6% | 24.2% |
| Refund rate | 0.4% | 1.0% | 2.4% |
No-shows are counted over all booked appointments, cancellations included. Lost revenue uses each location's average realized ticket. Discount rate is discounts as a share of gross service and product revenue. How discounts are recorded, including member pricing, varies by system. Refund rate is refunds as a share of collected revenue. Fee charges per missed appointment is fee charges divided by missed appointments (no-shows plus cancellations). Charges aren't linked to individual appointments, so it isn't the share of missed appointments that paid a fee.
10Forward view
The forward book is ahead of last year, and it splits by operating model
In early October, the median operator had 3.2% more appointments booked for dates after September than a year earlier. Operating model splits it: wellness-integrated operators were 10.8% ahead, and pure aesthetics was about flat.
+3.2% (better)
All operators
Median forward book vs the same date in 2025.
+0.7% (better)
Pure aesthetics
Median operator, vs the same date in 2025.
+10.8% (better)
Wellness-integrated
Median operator, vs the same date in 2025.
+3.8% (better)
Wellness-led
Median operator, vs the same date in 2025.
The forward book counts every appointment on the books in early October, when the data was pulled, for any date after the quarter ends, compared with the same count on the same date a year earlier. There's no fixed look-ahead window, so it includes everything booked ahead.
This is a snapshot on one date compared with the same date a year earlier, so treat it as an early read on Q4 demand, not a forecast.
What to do about it
Check your forward book against last year now. If it's behind, Q4 will be too unless rebooking at checkout improves. Pure aesthetics operators should look first: their forward book is flat on last year, while wellness-integrated operators are 10.8% ahead.
11Agentic analytics
AI use keeps growing, and teams ask most about revenue, services and scheduling
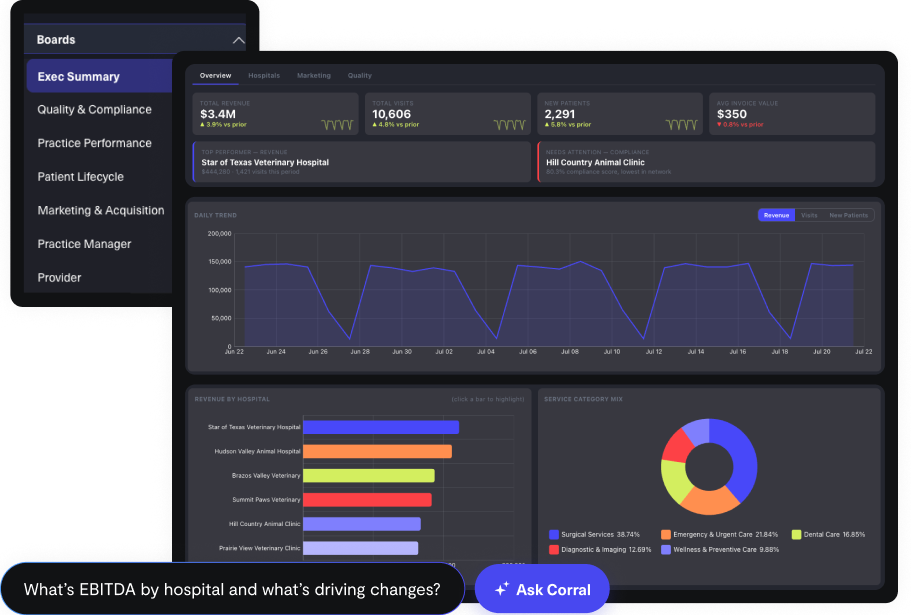
Use of AskCorral, CorralData's AI analyst, grew 2.5 times from Q2 to Q3, and at 81% of operators three or more people now ask questions of their data, up from 59% a quarter earlier. What they ask about most is revenue, services and scheduling.
Opening questions only; board summaries, dashboard edits and follow-ups are left out. A question can touch more than one topic, so shares add to more than 100%. Topics are assigned by keyword, so they are approximate.
Beyond dashboards: predict, model, act
What changed in Q3 is the mode of use, not just the volume. The top operators have moved past the dashboard era entirely. A templated report only answers the questions a reporting vendor picked in advance, for everyone at once, using the vendor's definition of every metric, whether or not it fits how your business runs. These operators ask their own questions, computed with their own definitions, bespoke to their service menu, their providers, their market, this week. And more people on each team are asking them, from owners to location managers and front-desk leads. These are real questions operators asked in Q3, verbatim from the query logs (names and places redacted):
- Revenue and salesGoing back as far as possible, what is the average revenue per open business day for each center?
- Revenue and salesBy location, how much do we do in payment-plan sales out of the total?
- Services and productsI’m curious how many of our CoolSculpting patients have also gotten Botox.
- Services and productsPlease investigate why bookings are down. Is there a specific service line that is down?
- Appointments and schedulingFor the appointments on the schedule this week, how long ago were they booked on average?
- Appointments and schedulingHow is appointment booking volume looking this month vs. last month? Break it down by clinic.
- Providers and staffWho was the top provider last month, and what was their service mix?
- Providers and staffHow can I see provider revenue separated out by products and services?
- Leads and marketingCan you give me a full funnel analysis for our HRT campaign and how it compares to our campaign in June?
- Leads and marketingWhat is our conversion rate on first-visit consultations? How many leads actually book a service?
- Leads and marketingWhich clinics had more leads created last week than the week before, and which had fewer?
- MembershipCan you give me a list of people who were members over the last three months but are not now?
- MembershipWhat is our HRT membership monthly churn rate?
- RetentionCan you show me the rebooking data broken down by location?
- Cross-sellCan you determine the % of patients who have been seen for both aesthetics and HRT or wellness?
Read the list again and notice what's not on it: nobody is asking for a report. No two of these questions would fit the same template, which is why templated reporting can't produce them. They are operating decisions in question form: a lapsed member to win back, a patient who left without rebooking, a campaign to compare, a provider conversation to have. And they move through three modes the canned-report world doesn't have: predict (how bookings are trending against last month), model (what share of patients cross between aesthetics and wellness) and act (a list of patients to call back today).
Turn this report into a plan
Questions worth asking your own data, by section of this report.
| Area | Question |
|---|---|
| Growth | “Split my revenue growth this quarter into new locations, existing patients and new patients.” |
| New and existing patients | “What did new patients buy on their first visit, by location?” |
| Retention | “Which of my top 10% of patients left their last visit without a next appointment booked?” “Model what one more point of 90-day rebooking would add to revenue this quarter, by location.” |
| Membership | “What share of my active patients are members, by location, and how did it change from last quarter?” |
| Service mix | “What share of my revenue came from injectables by location, and how did it change from last quarter?” |
| Wellness | “Which of my GLP-1 patients have never booked an aesthetics service?” “Which aesthetics patients visited in the last 90 days and have never bought wellness?” “Our GLP-1 patients: how many also buy aesthetics? Model the revenue if we matched the median cross-over rate.” |
| Marketing | “What did each new patient cost me in Google and Meta spend last month?” |
| Productivity | “What was my revenue per booked hour and utilization by provider last month?” “Which locations are below the median revenue per service hour, and what should each change first: price, discounting or service mix?” |
| No-shows | “How many no-shows last quarter had a card on file, and how many were charged?” “If we charged a fee on every no-show last quarter, what would we have collected? Which locations waive it most?” |
| Forward view | “How many appointments are booked for next month compared with this time last year?” |
| All sections | “Tell me which three things to fix this quarter to close the gap to the 75th percentile, ranked by dollars.” |
12Outperformers
What top performers do, and the trade-offs they make
Top performers here are the operators above the median revenue growth, compared with the rest of the panel. Two habits set them apart: winning new patients and earning more per booked hour. Two trade-offs come with that growth. And two habits hold up at any growth rate. For each, here's what the strong end of the panel reaches and the number to watch monthly.
What top performers do
They win new patients, and win them efficiently. New patients bring in 19.3% of revenue at top performers against 15.9% for the rest. At the strong end, operators grew their new-patient count 11.3% or more while the median operator's slipped 1.8%. Cost matters as much as volume. Across the panel, the strong end runs an LTV:CAC of about 36 to 1, against about 16 to 1 at the median, and pays $44 or less per new patient. Measure it on every new patient, not just the ones ad platforms claim.
Watch monthly: revenue from new patients, new-patient count against last year, and LTV:CAC.
They earn more per booked hour. Top performers earn $599 per booked hour against $527 for the rest, and the strong end earns $682 or more. Ticket is about the same in both groups ($404 against $388), so the difference is likely in what fills the hour, such as service mix and visit length, not a bigger invoice. Utilization doesn't track growth in this data (section 08), so raise what the hour earns first. Once it's well paid, filling more of it is the next lever: the median operator fills only 29.8% of scheduled provider hours.
Watch monthly: revenue per service hour by provider, then utilization.
The trade-offs they make
They discount more. Discounts take 18.8% of gross revenue at top performers against 14.9% for the rest. At the strong end, discounts take 11.3% or less. If you use them to win patients, check that those patients come back.
Watch monthly: discount rate, and whether discounted new patients rebook within 90 days.
They rebook less. Top performers rebook 69.8% of completed appointments within 90 days against 76.8% for the rest, and more of their patients visit only once (62.4% against 60.1%). At the strong end, operators rebook 76.5% or more. New patients add the most to growth when they come back.
Watch monthly: rebooking within 90 days, especially for new patients.
What holds up at any growth rate
They run membership as the product. Membership penetration is about the same for top performers and the rest (25.5% against 26.6%), so it isn't what set growth apart this quarter. Members still come back far more often: 90.4% of members came back against 50.6% of non-members. At the strong end, operators enroll 40.7% or more of active patients, against 26.6% at the median. Sell it at checkout, starting with your most frequent non-members.
Watch monthly: membership penetration, and member against non-member retention.
They put the whole team in the data. At 81% of operators, three or more people now ask questions of their data, up from 59% a quarter earlier. At the strong end, about 2.8 people per location do it, against 1.5 at the median. One person with a report login can't run the habits above. Managers who can check their own numbers can.
Watch monthly: how many people on your team ask questions of the data, beyond leadership.
Top performers are operators above the median revenue growth; figures for them and for the rest are the median operator in each group. No-show rates are about the same in both groups (1.9% against 2.1%). Strong-end levels are each measure's 75th percentile, or its 25th where lower is better, so they come from different operators measure by measure and describe what good looks like, not one operator's playbook. Every figure clears the same privacy rules as the rest of the report. This shows association, not cause.
What to do about it
None of these habits needs scale, and none is secret. What they share is a prerequisite: you can't run a habit you can't measure. Each one depends on seeing new-patient revenue, revenue per hour, discounting, rebooking, member economics and acquisition cost in one place, every month, and adjusting as you go.
13FAQ
Questions operators and investors ask
How fast are med spas and aesthetics practices growing in 2026?
The median operator grew revenue 17.4% in Q3 2026 compared with Q3 2025, and operators of every size grew. Same-store growth, which counts only locations open at least two years, was 7.0%, so newer locations account for much of the difference. See section 01.
Where is med spa revenue growth coming from?
What is a good average ticket for a med spa?
The median ticket is $396, and the middle half of operators run from $315 to $529. Ticket depends on operating model: $498 for pure aesthetics, $366 for wellness-integrated and $276 for wellness-led operators, so compare yours with operators who run the same model. See section 05.
What is a good rebooking rate for a med spa?
At the median operator, 71.0% of completed appointments led to another booking within 90 days. A quarter of operators rebook 76.5% or more, and a quarter 61.5% or less. See section 03.
Do memberships improve patient retention?
Members come back far more often: 90.4% of members returned in Q3 against 50.6% of non-members, and members spend about 1.7 times as much. Part of the gap is who chooses to join. The bigger difference between operators is enrollment, which runs from 14.3% to 40.7% of active patients across the middle half. See section 04.
Is GLP-1 and wellness revenue still growing at med spas?
Wellness held steady: it was 9.0% of revenue at the median operator, level with a year ago (9.1%) and roughly double its early-2024 share. Only 9.7% of GLP-1 patients were new to the practice, so most GLP-1 revenue comes from existing patients. See section 06.
How much does it cost a med spa to acquire a new patient?
Blended acquisition cost, Google and Meta spend divided by all new patients, was $95 at the median operator. A quarter pay $44 or less and a quarter $280 or more, depending partly on what they sell. Median LTV:CAC is about 16 to 1. See section 07.
What is a good revenue per provider hour?
A booked service hour earns $591 at the median operator, with the middle half between $442 and $682. Completed appointments fill 29.8% of scheduled provider hours, and the two measures are unrelated, so check both. See section 08.
How much revenue do no-shows and discounts cost a med spa?
Missed appointments cost the median operator 2.1% of revenue, and fee charges equal only 4.2% of missed appointments. Discounts are a much bigger share, at 16.6% of gross revenue. See section 09.
What does the forward book say about Q4 2026?
In early October the median operator had 3.2% more future appointments booked than a year earlier. It splits by operating model: wellness-integrated operators were 10.8% ahead, wellness-led operators 3.8% and pure aesthetics about flat at 0.7%. See section 10.
How is this benchmark measured?
Every figure comes from operators' own practice management systems through CorralData, not from a survey. The data set covers 150+ brands, 500+ locations and $250M+ of Q3 2026 revenue. We publish the 25th percentile, median and 75th percentile only, and no operator is named or identifiable. See Appendix D.
Interactive · Benchmark yourself
Where would your practice rank?
Enter any numbers you know. Every field is optional. Your position is worked out in your browser against this report's published p25, median and p75. Nothing you type is stored or sent anywhere.
Appendix A · Benchmarks
Q3 2026 benchmarks
- Each row shows how operators are spread on one measure.
- Median is the typical operator: half sit above it and half below.
- p25 to p75 is where the middle half of operators fall.
- Each column is ranked on its own, so the values in one column come from different operators and don't add up to 100%.
- Coverage is the share of the panel's locations where the measure can be computed.
- Withheld means too few operators to publish safely.
| Metric | p25 | Median | p75 | Coverage |
|---|---|---|---|---|
| 01 · Growth | ||||
| Total revenue growth, year over year | +1.8% | +17.4% | +21.9% | 98.9% |
| Same-store revenue growth, year over year | −6.2% | +7.0% | +19.6% | 93.1% |
| Revenue per location per month | $140,042 | $171,742 | $220,582 | 55.1% |
| Existing-patient revenue growth, year over year | −2.7% | +8.4% | +23.5% | 91.8% |
| New-patient revenue growth, year over year | −21.4% | −6.9% | +0.7% | 91.8% |
| New-patient count growth, year over year | −18.6% | −1.8% | +11.3% | 96.2% |
| 03 · Retention | ||||
| Rebooked within 90 days | 61.5% | 71.0% | 76.5% | 83.6% |
| New patients back within 60 days (Q2 2026 new patients) | 41.3% | 45.2% | 51.6% | 84.0% |
| Visits per patient | 1.50 | 1.62 | 1.83 | 83.6% |
| Patient lifetime value | $1,321 | $1,628 | $2,578 | 83.6% |
| 04 · Membership | ||||
| Membership penetration | 14.3% | 26.6% | 40.7% | 79.8% |
| Member retention | 76.2% | 90.4% | 94.5% | 39.3% |
| Non-member retention | 40.4% | 50.6% | 56.9% | 44.4% |
| Member vs non-member spend | 1.29× | 1.70× | 2.20× | 78.9% |
| 05 · Service mix and ticket | ||||
| Average ticket | $315 | $396 | $529 | 100.0% |
| Neurotoxin price per unit | $10.76 | $11.94 | $12.24 | 68.4% |
| Filler price per syringe | $655 | $700 | $729 | 73.6% |
| 06 · Wellness | ||||
| Wellness share of revenue | 1.1% | 9.0% | 16.4% | 100.0% |
| 07 · Marketing efficiency | ||||
| LTV:CAC (ad-attributed patients) | 4.84× | 16.13× | 35.73× | — |
| Blended CAC (lower is better) | $44 | $95 | $280 | 50.2% |
| 08 · Productivity | ||||
| Revenue per service hour | $442 | $591 | $682 | 84.9% |
| Revenue per provider | $54,964 | $83,782 | $113,865 | 84.9% |
| Provider utilization | 18.1% | 29.8% | 39.4% | 78.9% |
| Provider turnover (lower is better) | 6.1% | 10.1% | 13.1% | 81.6% |
| 09 · No-shows and discounts | ||||
| No-show rate (lower is better) | 1.4% | 1.8% | 2.4% | 84.9% |
| Revenue lost to no-shows (lower is better) | 1.8% | 2.1% | 3.1% | 84.9% |
| Appointment completion | 84.0% | 85.0% | 89.0% | 84.9% |
| Discount rate | 11.3% | 16.6% | 24.2% | 99.8% |
| 10 · Forward view | ||||
| Forward book growth, year over year | −36.0% | +3.2% | +22.4% | 65.1% |
Each operator's figure is pooled across its locations, then percentiles are taken across operators. No minimums or maximums are published.
Coverage is the share of the panel's active locations at brands where the measure can be computed, the same definition as H1. A dash marks derived measures, which have no coverage figure of their own.
Appendix B · Size
Q3 2026 benchmarks by operator size, medians
- Each column is the median operator in that size group. Size is the operator's number of locations.
- Each column is ranked on its own, so the values across a row come from different operators.
- Size groups are small, so read the gaps between them as direction, not precision.
- Withheld means too few operators to publish safely.
| Metric | All operators | 1-5 | 6-20 | 21+ |
|---|---|---|---|---|
| 01 · Growth | ||||
| Total revenue growth, year over year | +17.4% | +15.2% | +17.1% | +18.2% |
| Same-store revenue growth, year over year | +7.0% | +7.3% | +2.8% | +2.3% |
| New-patient count growth, year over year | −1.8% | −1.2% | −17.4% | +2.5% |
| 03 · Retention | ||||
| Rebooked within 90 days | 71.0% | 70.3% | 68.4% | 71.6% |
| New patients back within 60 days (Q2 2026 new patients) | 45.2% | 48.8% | 45.5% | 41.9% |
| Visits per patient | 1.62 | 1.59 | 1.73 | 1.70 |
| Patient lifetime value | $1,628 | $1,759 | $1,885 | $1,519 |
| 04 · Membership | ||||
| Membership penetration | 26.6% | 30.9% | 27.8% | 10.4% |
| Member retention | 90.4% | 86.2% | 89.3% | Withheld: too few operators to publish safely |
| Non-member retention | 50.6% | 53.2% | 48.5% | Withheld: too few operators to publish safely |
| Member vs non-member spend | 1.70× | 1.71× | 1.79× | 1.66× |
| 05 · Service mix and ticket | ||||
| Average ticket | $396 | $422 | $403 | $351 |
| Neurotoxin price per unit | $11.94 | $12.27 | $11.69 | $11.73 |
| Filler price per syringe | $700 | $699 | $725 | $654 |
| 06 · Wellness | ||||
| Wellness share of revenue | 9.0% | 8.4% | 8.2% | 9.0% |
| 08 · Productivity | ||||
| Revenue per service hour | $591 | $628 | $497 | $480 |
| Revenue per provider | $83,782 | $83,906 | $100,090 | $59,679 |
| Provider utilization | 29.8% | 26.4% | 33.7% | 34.3% |
| 09 · No-shows and discounts | ||||
| No-show rate (lower is better) | 1.8% | 1.8% | 1.9% | 1.9% |
| Revenue lost to no-shows (lower is better) | 2.1% | 2.2% | 2.1% | 2.2% |
| Appointment completion | 85.0% | 84.4% | 84.1% | 88.4% |
| Discount rate | 16.6% | 14.9% | 20.3% | 17.6% |
| 10 · Forward view | ||||
| Forward book growth, year over year | +3.2% | +4.8% | −19.2% | +38.4% |
Median operator in each group. Size is the operator's number of locations. Withheld where a group is too small to publish safely. Groups are small, so read the gaps as direction, not precision. Only measures taken at the location level are cut by size; acquisition cost, ad channel mix, provider turnover, revenue per location and AskCorral use are left out. LTV:CAC is not cut by size.
Appendix C · Operating models
Q3 2026 benchmarks by operating model, medians
- Each column is the median operator for one operating model, set by wellness share of revenue: pure aesthetics under 5%, wellness-integrated 40% to 5%, wellness-led over 30%.
- Each column is ranked on its own, so the values across a row come from different operators.
- Withheld means too few operators to publish safely.
- Methodology has the full definitions.
| Metric | Pure aesthetics | Wellness-integrated | Wellness-led |
|---|---|---|---|
| 01 · Growth | |||
| Total revenue growth, year over year | +17.1% | +21.2% | Withheld: too few operators to publish safely |
| Same-store revenue growth, year over year | +7.3% | +5.1% | Withheld: too few operators to publish safely |
| New-patient count growth, year over year | −7.6% | +7.4% | Withheld: too few operators to publish safely |
| 03 · Retention | |||
| Rebooked within 90 days | 66.4% | 74.5% | 82.6% |
| New patients back within 60 days (Q2 2026 new patients) | 45.1% | 43.8% | 61.9% |
| Visits per patient | 1.54 | 1.71 | 2.40 |
| Patient lifetime value | $1,993 | $1,712 | $1,449 |
| 05 · Service mix and ticket | |||
| Average ticket | $498 | $366 | $276 |
| 06 · Wellness | |||
| Wellness share of revenue | 0.9% | 13.1% | 73.4% |
| 08 · Productivity | |||
| Revenue per service hour | $608 | $486 | $491 |
| 09 · No-shows and discounts | |||
| No-show rate (lower is better) | 1.4% | 2.2% | 2.8% |
| Discount rate | 14.4% | 17.9% | 7.7% |
| 10 · Forward view | |||
| Forward book growth, year over year | +0.7% | +10.8% | +3.8% |
Pure aesthetics: under 5% of revenue from wellness. Wellness-integrated: 5-30%. Wellness-led: over 30%. Withheld means the group is too small to publish safely, or showing it would reveal another group's value by subtraction.
Appendix D · Methodology
How these numbers are built
All figures come from each operator's own practice management system, read directly from its CorralData workspace, not from a survey. The data set covers 150+ brands and 500+ locations in aesthetics. This edition benchmarks the med spa and aesthetics practices within it. Counting units: an operator is an owning group, a brand is a practice name, and a location is one site. Percentiles are taken across operators, and each cell needs a minimum number of operators before it publishes. An operator counts as offering both wellness and aesthetics when each line is at least 1% of its patients and at least 20 patients.
Each operator's figure is pooled across all its locations, and percentiles are taken across operators, so each business counts once. One measure is the exception and is a median across locations rather than operators: member vs non-member spend (each location's average member spend over its average non-member spend). It's built location by location, so it can't be pooled into one figure per operator. It still needs a minimum number of operators and locations, and no single operator may hold more than 40% of the locations. Revenue is accrual basis, service and product, net of discounts.
Operating models are set by wellness share of revenue: pure aesthetics under 5%, wellness-integrated 5% to 30%, wellness-led over 30%.
Coverage is the share of the panel's active locations at brands where the measure can be computed, the same definition as H1.
Data freshness: a location whose newest activity is more than about two weeks before the end of the quarter sits out that quarter rather than contributing a partial one. That covers closed clinics and systems mid-migration; renamed clinics are matched to their new names first.
Privacy: a figure is published only when enough independent operators contribute and no single operator dominates. Where publishing one group would reveal another by subtraction, that group is withheld too. We never publish minimums, maximums or top-1 figures, or the number of operators behind a figure.
Definitions
- Total revenue growth, year over year
- Each operator's revenue in the quarter vs the same quarter a year earlier, all locations included. Service and product revenue, net of discounts.
- Same-store revenue growth, year over year
- Revenue growth at locations open at least two years, so newer locations are left out.
- Revenue per location per month
- Operator revenue divided by its locations and by the months in the period.
- Existing-patient and new-patient revenue growth, year over year
- Revenue growth from existing and from new patients, at locations open in both quarters. A patient counts as new or existing separately in each quarter, by first-ever activity.
- New-patient count growth, year over year
- Patients whose first-ever purchase fell in the quarter, vs the same quarter a year earlier.
- Rebooked within 90 days
- Share of completed appointments followed by another booking within 90 days. Future scheduled bookings count.
- New patients back within 60 days
- Share of first-time patients who returned within 60 days, for patients whose first-ever visit was in the previous quarter (Q2 2026), so every patient has a full 60 days.
- Visits per patient
- Visits divided by distinct patients. A visit is one patient on one day with at least one completed service.
- Patient lifetime value
- All-time service and product revenue per patient, through the end of the period.
- Membership penetration
- Patients with a membership payment in the period, divided by active patients.
- Member retention
- Share of members active in the prior period who returned this period.
- Non-member retention
- Share of non-members active in the prior period who returned this period.
- Member vs non-member spend
- Average spend per member divided by average spend per non-member.
- Average ticket
- Net service and product revenue divided by visit invoices. Standalone membership and gift-card invoices are excluded.
- Neurotoxin price per unit
- Net neurotoxin revenue divided by units sold. Botox-scale units only (Botox, Xeomin, Jeuveau, Letybo). Dysport and Daxxify units are not comparable and are left out, and operators that price per area rather than per unit are excluded.
- Filler price per syringe
- Net filler revenue divided by syringes sold. It covers all filler products sold per syringe, so it may combine hyaluronic acid fillers with higher-priced biostimulators, and the range within each is wide.
- Wellness share of revenue
- Revenue from weight loss and GLP-1, hormones and peptides, and IV and vitamin services as a share of total revenue.
- LTV:CAC
- The operator's average lifetime revenue per patient, multiplied by its new patients attributed to Google and Meta ads, divided by Google and Meta ad spend. It estimates payback rather than measuring what those patients spent.
- Blended CAC
- Google and Meta ad spend divided by all new patients (first-ever purchase in the period).
- Revenue per service hour
- Service revenue divided by booked provider service hours.
- Revenue per provider
- Service revenue divided by distinct providers. A provider who works at several locations counts once.
- Provider utilization
- Completed appointment time as a share of scheduled provider hours.
- Provider turnover
- Of providers with appointments in the previous quarter, the share with no appointments this quarter.
- No-show rate
- No-show appointments divided by all booked appointments, cancellations included.
- Revenue lost to no-shows
- No-shows multiplied by the location's average realized ticket, as a share of revenue.
- Appointment completion
- Share of booked appointments that were completed.
- Discount rate
- Discounts as a share of gross service and product revenue.
- Forward book growth, year over year
- Every appointment on the books when the data was pulled in early October, for any date after the quarter ends (September 30), compared with the same count on the same date a year earlier. There is no fixed look-ahead window.