




 " alt="">


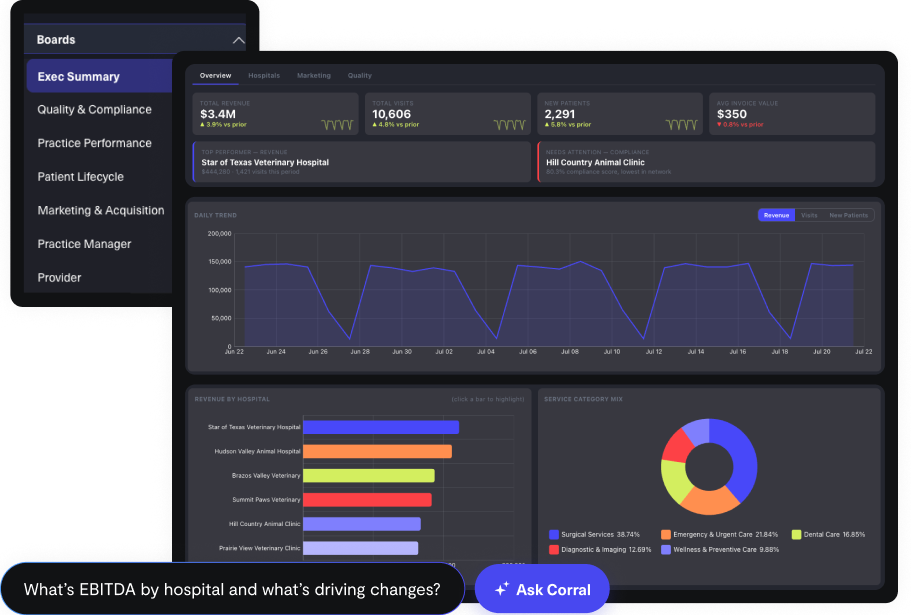















The dashboard is dead.
We know dashboards better than anyone. So we built what replaces them. Data Apps are purpose-built tools — connected to your own data, ready for your whole team, doing the actual work your business needs done.
If you can describe it, we can build it.
Daily co-pilot for location operations.
This is what a franchise owner sees every morning: revenue pace, action queue, every opportunity ranked and ready. Members past due to recall. Schedule gaps matched to patients. No-show follow-ups surfaced automatically.
This isn't a dashboard showing you what happened. It's a tool that lets you act on it right away. Have a question about what you're seeing? Just ask — AskCorral is built right in.
Live demo Tap any card to interact →
A retention command center. No analyst required.
See which customer cohorts are slipping, where your marketing budget will have the most impact, and which channels are generating the highest LTV — all from your latest synced data.
Your whole marketing and CS team has the same view. No one is waiting on a report. They're already acting on it.
Live demo Click tabs to explore →
| Cohort | Customers | Avg LTV | Repurchase | Churn Risk |
|---|---|---|---|---|
| Instagram — Q1 '25 | 2,140 | $408 | 68% | Low |
| Paid Search — Q2 '25 | 1,880 | $291 | 54% | Medium |
| TikTok — Q3 '25 | 3,210 | $188 | 41% | High |
| Email / Organic | 940 | $512 | 79% | Low |
| Influencer — Q4 '25 | 1,560 | $244 | 48% | Medium |
Every team has a tool they've always wished existed.
What stopped these from existing wasn't imagination — it was feasibility. A custom tool on your own data used to mean a data team to model it, engineers to build it, a designer to make it usable, and a budget ask that rarely survived approval. Now it's a prompt and an afternoon. If it runs on your data, we can build it.
"I live in 6 different tabs trying to figure out if today is on track."
You stop waiting for the morning standup to find out what's behind.
"I'm finding out we missed budget when the month is already over."
You stop finding out about misses after the fact.
"I don't know which channels are actually driving retention until it's too late."
You stop reallocating budget based on last quarter's data.
"I walk into every appointment without knowing what this patient is due for or what to recommend."
You stop treating every appointment like a first visit.
"By the time I spot a churn risk, the renewal conversation is already awkward."
You stop finding out about churn risk in the exit survey.
"I get 12 different decks from 12 different teams. None of them match."
You stop waiting on the weekly update to know what's real.
From idea to live tool — in one conversation.
No engineers, no sprints, no tickets. Open AskCorral, describe what your team needs, and it exists by the end of the afternoon.
Describe
Describe what you want to build. "A chair-side prep sheet for today's appointments — each patient with their service, upsell opportunity, and rebooking window." That's enough.
Preview
AI builds it and shows you a live preview inside the chat. Refine from there — ask for changes in plain language until it's exactly right.
Add to Board
When you're happy with it, say "looks good" — it's added to your CorralData board automatically. No copy-paste, no manual steps.
Use
Your data, ready to use. Open it like any other board. Data updates automatically, and you can dig deeper with AskCorral.
What makes these different from an AI prototype.
Any AI can build you a demo. What it can't do is make that demo reliable over time, for your whole team, built on your latest synced data.
The model that builds the app can be Claude, GPT-4, or whatever ships next. That part is commoditizing fast. What doesn't commoditize is the layer underneath.
Up-to-date data
CorralData is the data warehouse underneath — connecting, modeling, and maintaining your data is what we already do. Data Apps query it on every load, so the numbers reflect your latest data sync, never a snapshot you pasted in.
Org-wide
Lives on your CorralData board, accessible to everyone whose permissions allow. Not buried in someone's chat history.
Right people, right data
Everyone sees their data and nothing they shouldn't. Access follows your existing team structure automatically — no manual configuration needed.
Ask anything in the tool
Type a question in plain English — "Which locations underperformed this month?" — and get an answer from your data. No SQL, no analyst, no waiting.
Permanent
Doesn't disappear when someone closes a tab. Exists tomorrow, next month, next quarter — and updates itself.
What would your team build?
30 minutes. We'll show you the platform live and build something from a description of what your business actually needs.