

 " alt="">

















Most of your systems are built to operate workflows, not for reporting and analytics.
The systems your business uses for everyday operations — your EMR, CRM, scheduling software, point of sale, etc. — are primarily systems of record. They generate data as a byproduct of running your workflow: booking an appointment, taking a payment, logging who a patient is. Making that data useful for business intelligence, and enabling AI to accurately answer questions like “how should paid media be optimized to get to our growth target?”, requires data to be joined across several of these systems.
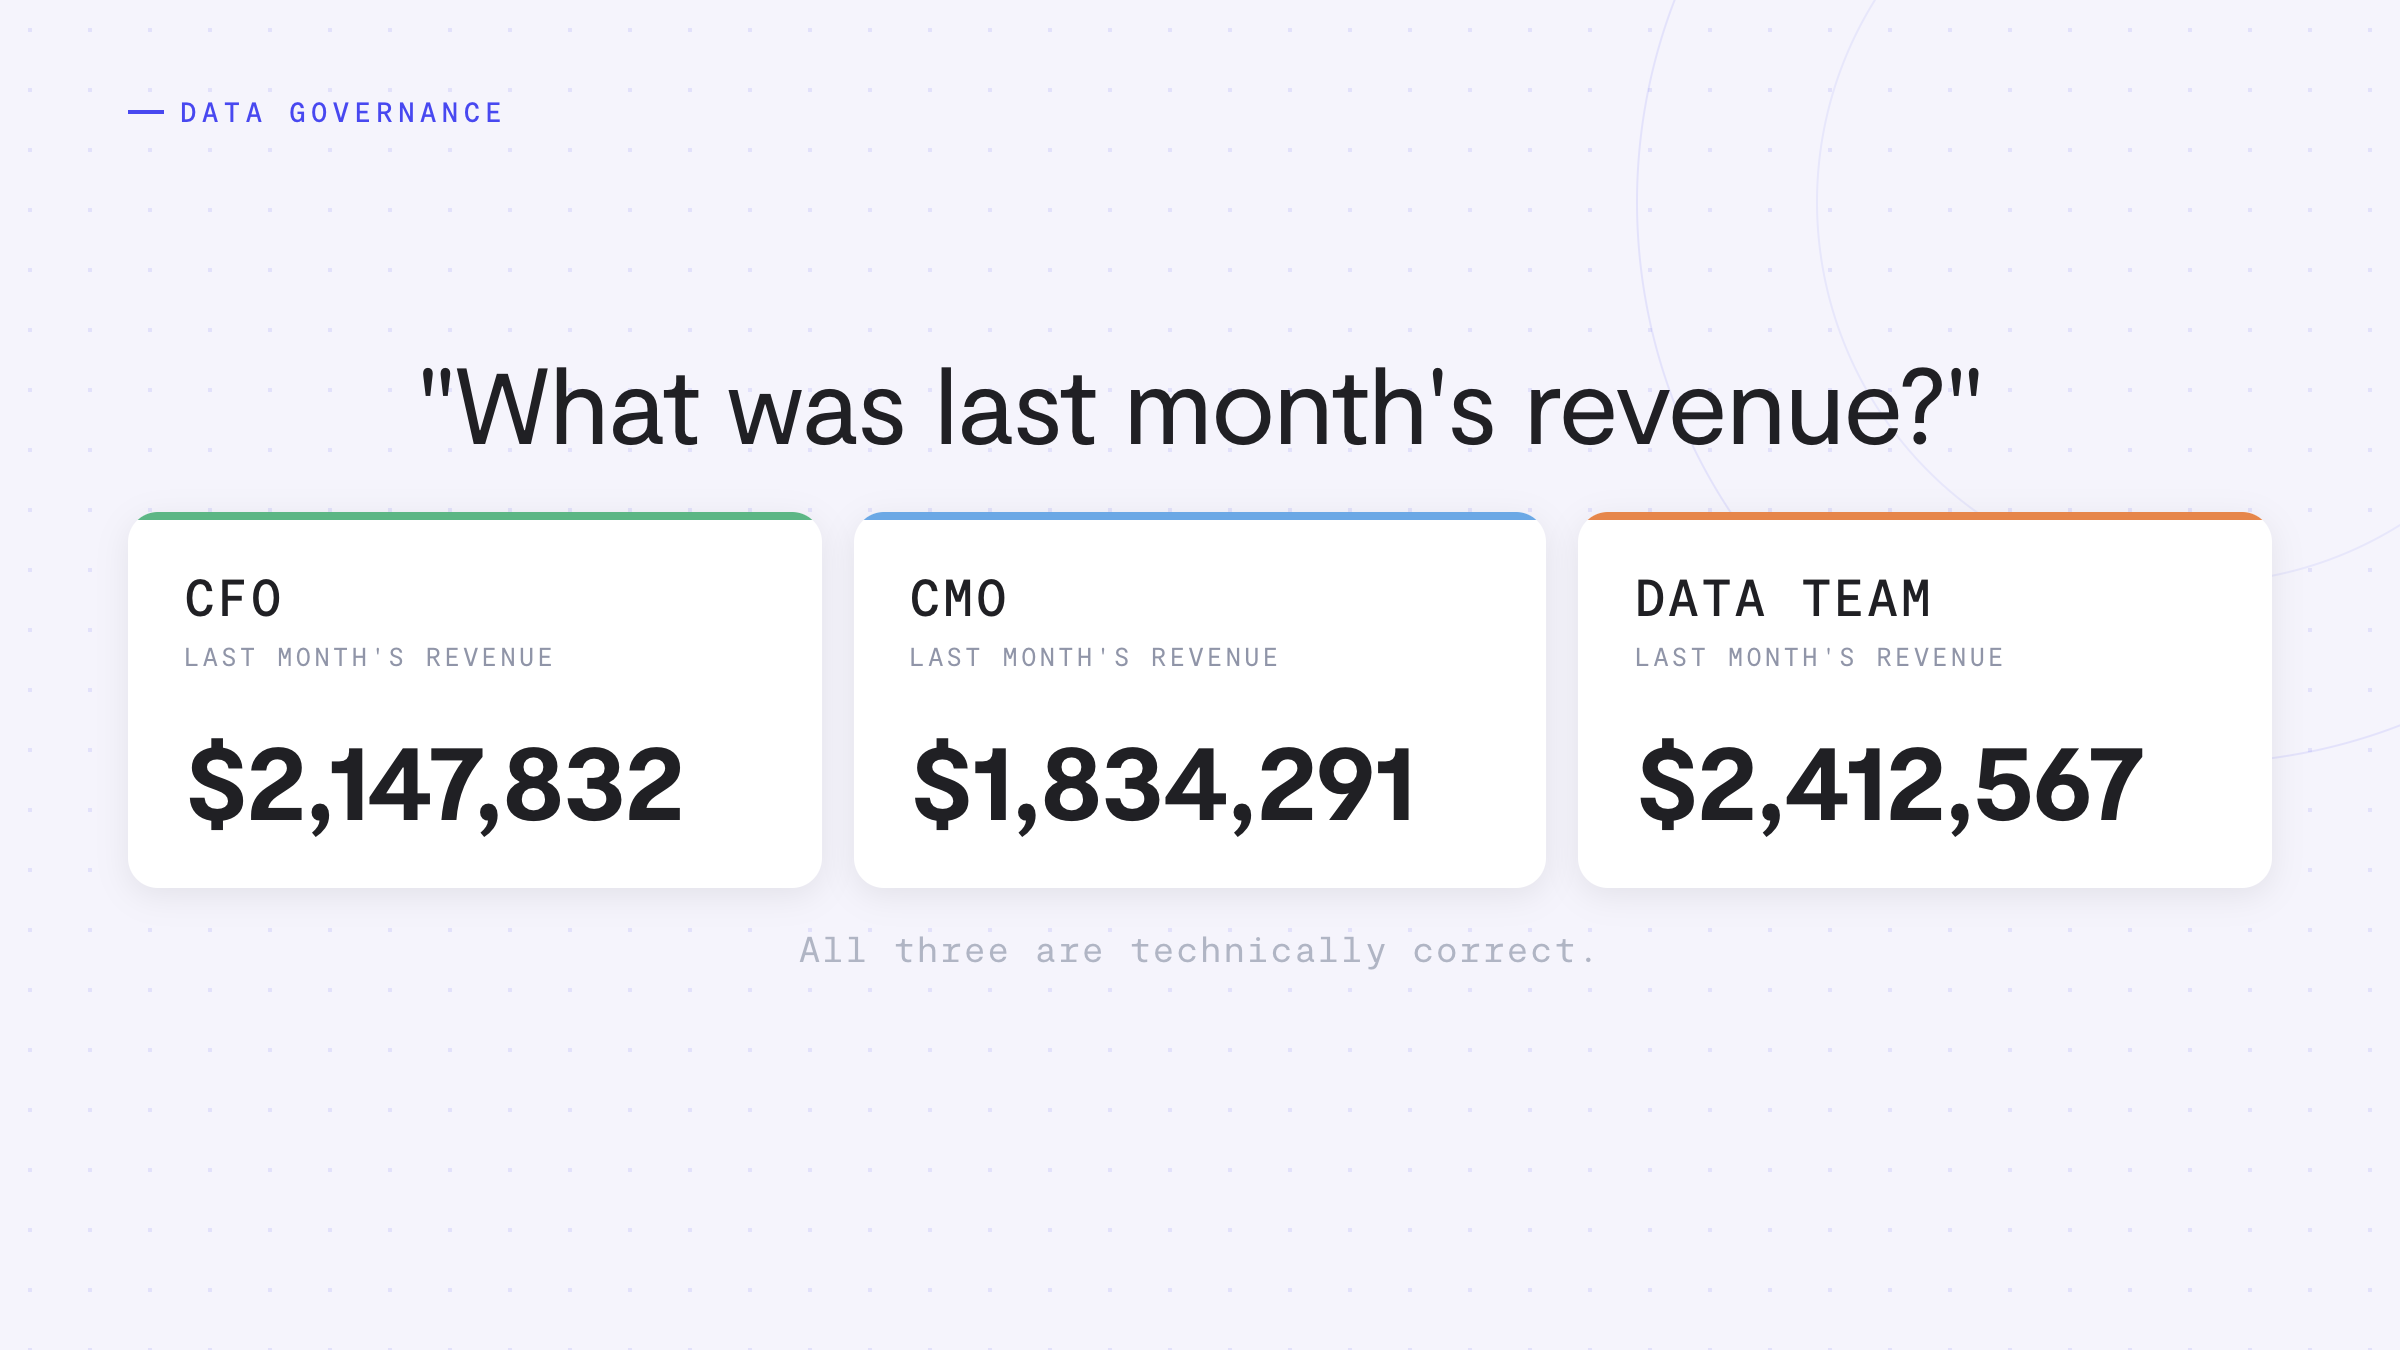
If a reporting dashboard is built straight from those source systems, more than one thing goes wrong at once. The same appointment shows up twice because two systems logged it independently. A typo on an intake form turns one patient into two. And underneath that sits the harder problem: what's the truth? What counts as a “new patient” or “net revenue”? That should be determined by how your business wants it defined, not your source systems.
The takeaway: Turning operational data into something usable for reporting, business intelligence, and AI analytics requires cleaning it, structuring it, and encoding the business decisions that tell it what it means.
The CorralData Architecture
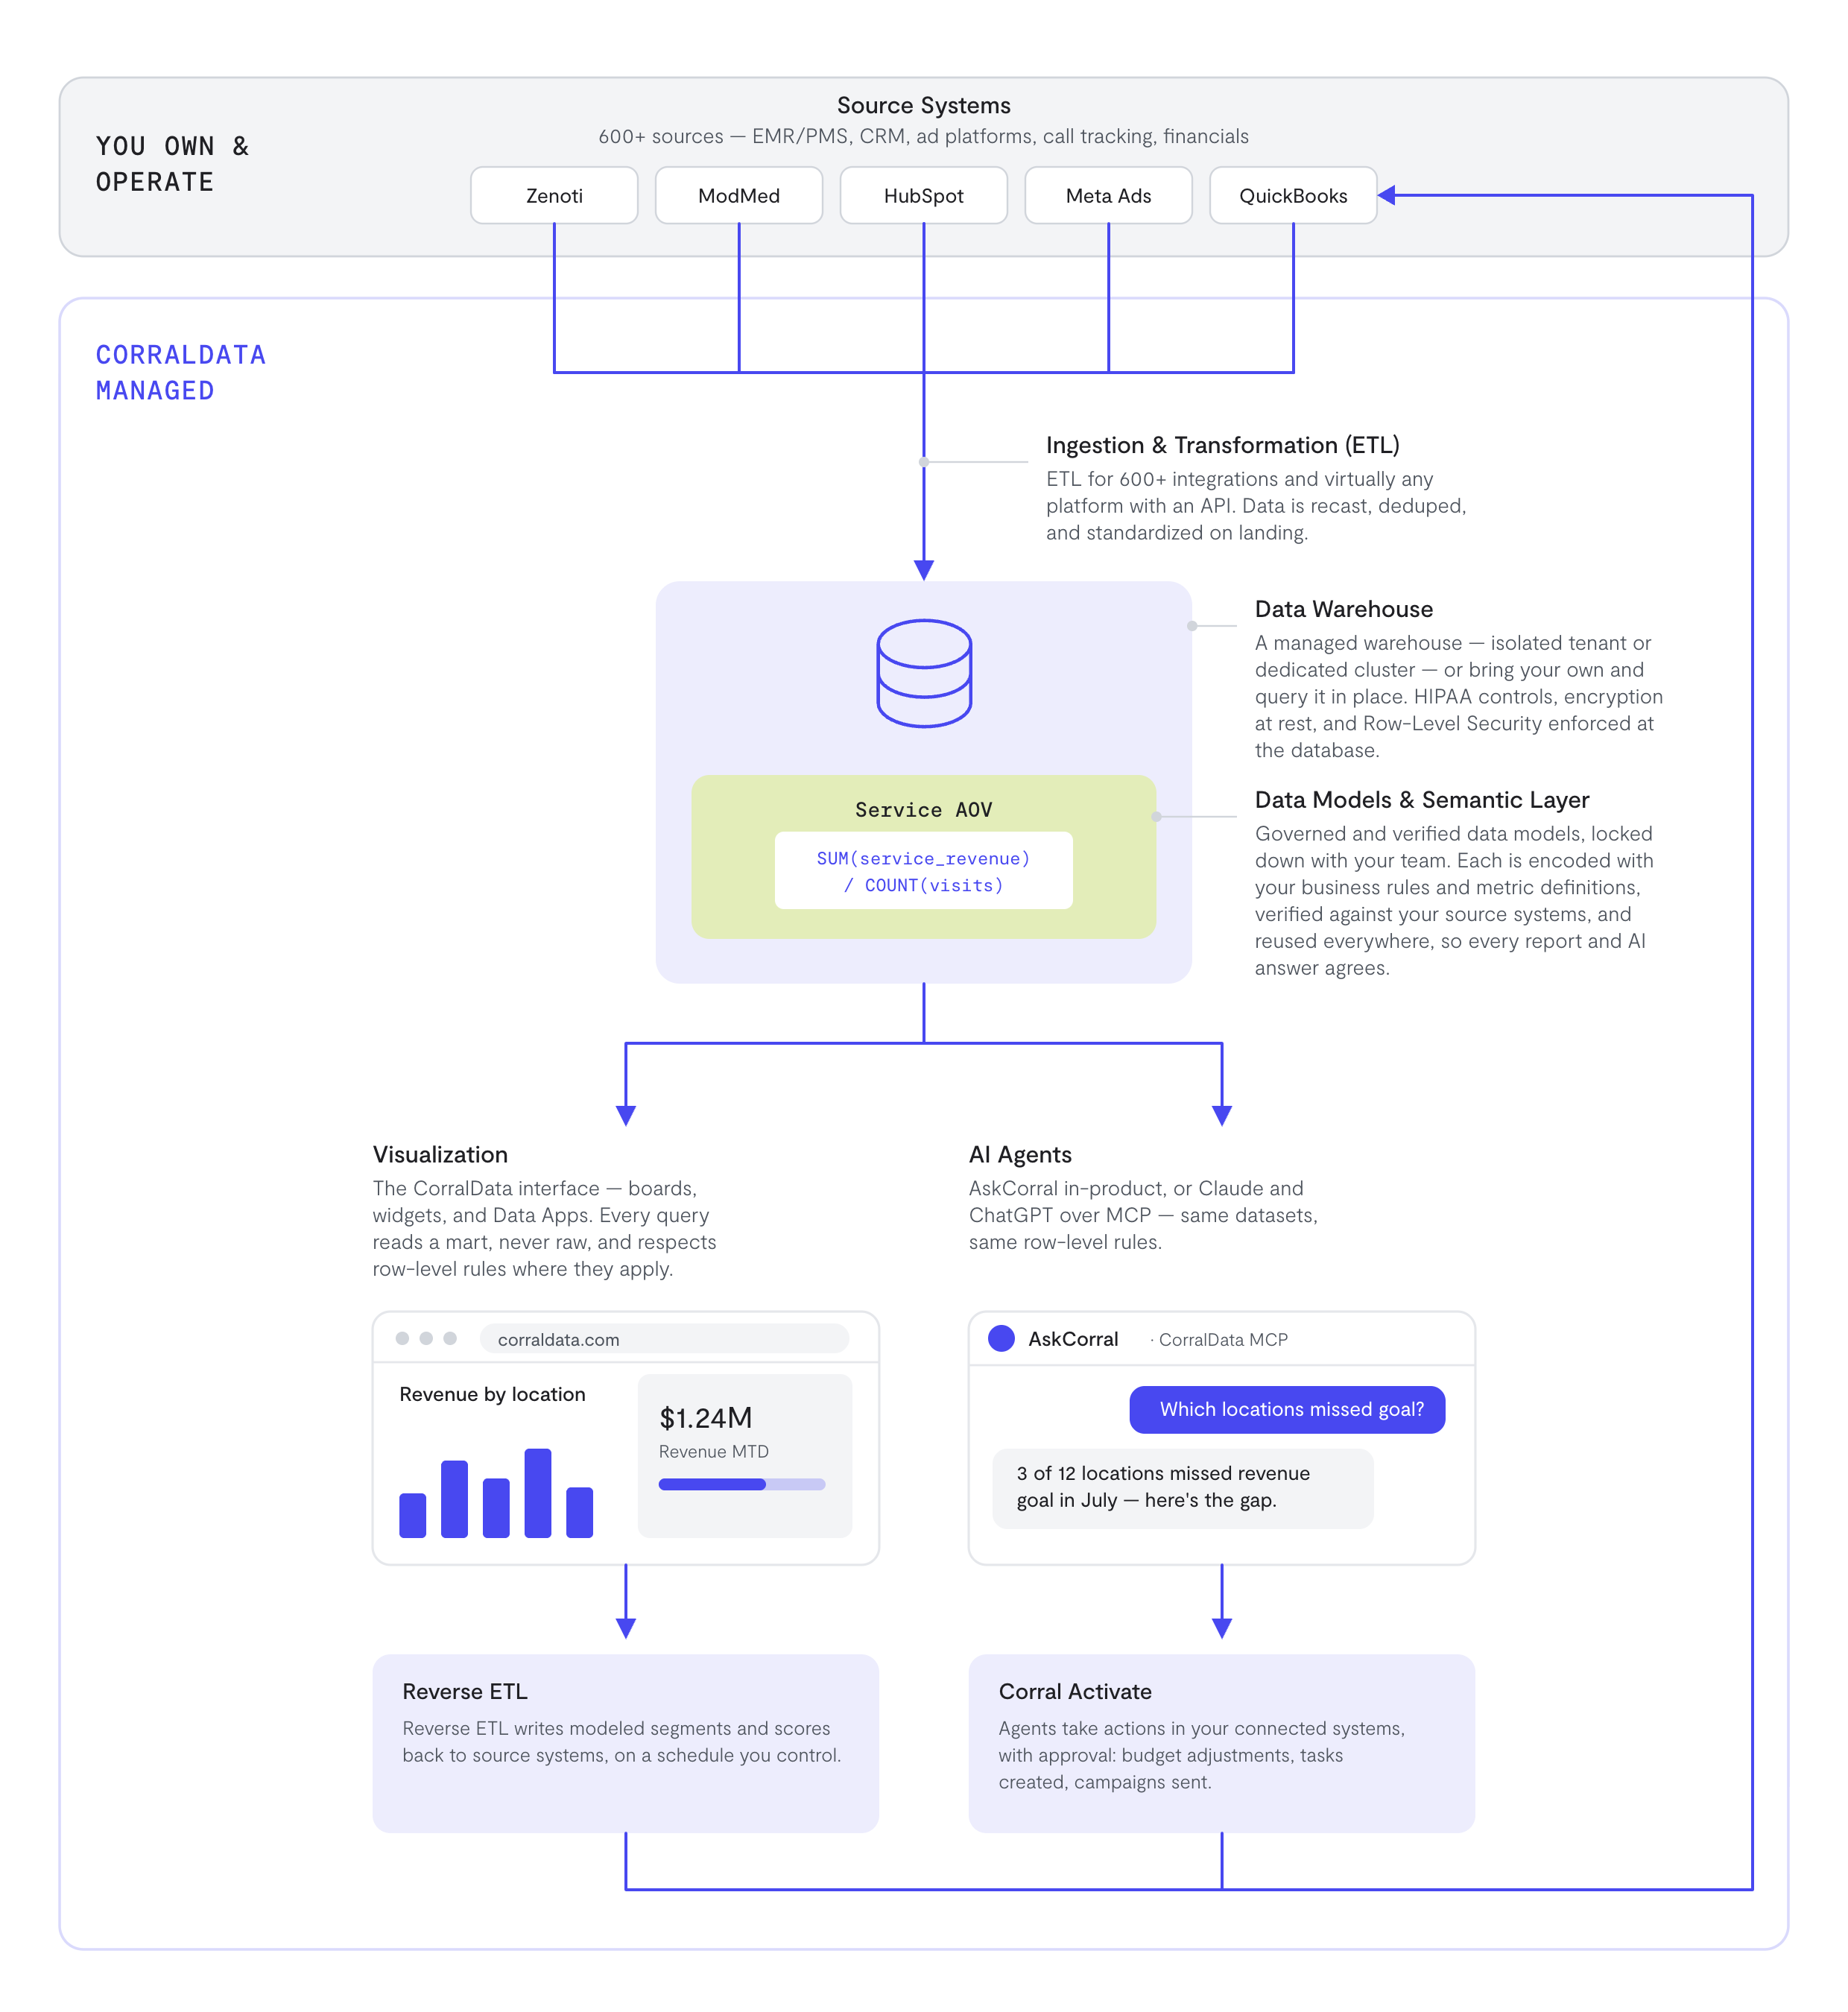
CorralData's whole stack is below, and it shows how data flows from your source systems through to data visualization and AI agents. This piece will cover the middle: from ingestion and transformation to data models and the semantic layer.
What happens after data is connected
Your data is processed through five steps before it's used in dashboards or queried by AI:
Step 01
Sync data
Data from every source system is extracted and synced into the data warehouse on a set schedule. Every successful sync automatically updates the Data Dictionary with what each table stores, what each column means, and how many columns it has.
This is structural, and catalogs what's sitting in the warehouse, not what any of it means for the business — that comes in Step 3.
Step 02
Clean and standardize
When data first lands in the warehouse, it's raw, which means it's shaped the way each source system sent it, and can be messy, including cryptic column names and different conventions per system. Transformation cleans that up and reshapes raw tables into clean, consistent, report-ready tables.
Standardizes formats and fixes structural inconsistencies. For example, a date stored as text in one system and as a timestamp in another becomes one format.
Removes redundant records. For example, a cancelled appointment logged two different ways across systems becomes one cancelled appointment.
We reconcile the cleaned data against the source systems. If the two don't agree within a fraction of a percent, we don't move forward. That said, if a source system already holds an error — for example, a typo in a Google Sheet feeding the warehouse — this is where we're most likely to catch it and flag it to your team to rectify. We can't manufacture a number that never existed at the source. What we can promise is that once a number is right, it stays right everywhere.
Step 03
Decide what things mean, and who sees what
As we begin data modeling, two things have to be decided: what metrics mean (definitions), and who's allowed to see which rows (related to row-level security).
Deciding what things mean
CorralData brings standard metric definitions for your vertical, so your team confirms a starting point instead of defining everything from scratch.
Define metrics your way. For example, if your business measures revenue or a new customer in a specific way, this is the time to share it.
Each of these gets documented: the metric name, its definition in plain language, and the formula behind it.
Deciding who sees what
If your account needs row-level security (RLS), so that specific team members can only see the data they're allowed to see on a shared board, we build the tables to filter that way from the start. Deciding it after the tables exist isn't a setting we flip; it's a rebuild of every affected dataset.
Step 04
Build the reusable pieces: data models
Using the decisions from Step 3, we assemble the clean data into data models: the queryable tables AskCorral reads to answer questions and build boards and data apps from.
Data models are organized around the entities of a business, not around individual metrics: appointments, sales, customers, locations, services, employees, etc. Each model brings together everything about one of those entities — the events that happened and the things involved in them — into a single ready-to-query table.
Building this way means one model can answer many different questions without being rebuilt every time someone asks something new. For example, one appointment model can answer questions about revenue, visit volume, no-show rate, and provider utilization. A model built narrowly around one metric only ever answers that one question.
It also changes what AI can do with the data. Because models represent entities rather than fixed answers, AskCorral — or your own AI agent with CorralData MCP connected — can combine models to answer questions nobody built in advance: appointments joined with locations, customers joined with services.
Each model is written in SQL, which is where a metric definition or business rule (from Step 3) can actually be enforced. “Revenue excludes gift cards” written as a query becomes a column every board, report, and AI answer reads the same way.
Step 05
Add the semantic layer and governance controls
With data models in place, we have the building blocks for reporting, dashboards, and AskCorral to answer your business questions. That said — and this is a challenge for AI analytics across the industry — there are still cases where two people ask about revenue and get two different numbers. That isn't because the data is wrong, it's because there's more than one way to calculate it: a different join across data models, a different filter, a different definition of what counts. Left ungoverned, AI can take various paths and land on a different answer each time. CorralData adds a semantic layer and data governance controls to prevent that from happening.
The semantic layer
Think of it as the instruction manual for AI on how to use the data models: it spells out metric definitions, how a data model can connect to other models, and what different time windows mean and how they should be applied. This ensures a question, which AI translates into a SQL query, resolves the same way every time. There's no separate screen for this — it's attached to the data models.
Governance
Once a data model is built, it needs to be protected. Every model carries controls for who can author and edit it, whether it's locked down (governed) or open, and whether it's been verified.
Same verified numbers, wherever they're viewed
That is the whole path: raw operational data landed and cleaned in the data warehouse, the definitions agreed on with your team, data models built around the entities of your business, and a semantic layer and governance controls locking those definitions and joins in place. That's what feeds your CorralData boards, your scheduled reports, and AskCorral when someone asks a business question.
And if your account needs row-level security, it's enforced at the database, and AskCorral respects the same boundary. AskCorral only answers from what a user is authorized to see. If a data model is out of scope, it says so instead of guessing or working around the restriction.
Five steps, all of them in service of one thing: a number that is defined once and means the same thing everywhere it is used.
data models
Cleaned, reconciled, defined with your team, and governed, ready to be queried
This is the unglamorous part of analytics, and it is most of the work. We do it so your team can spend their time acting on the numbers and insights with confidence.
See how this works for your data
See how business questions are answered accurately from your own data in a live demo with our team.
Book a Demo